Figures in the IPCC Special Report on Global Warming of 1.5°C (SR15)
Posted
Background
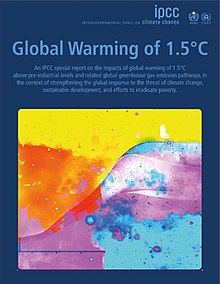
The IPCC's Special Report on Global Warming of 1.5°C (SR15), published in October 2018, presented the latest research on anthropogenic climate change. It was written in response to the 2015 UNFCCC's “Paris Agreement” of
holding the increase in the global average temperature to well below 2 °C above pre-industrial levels and to pursue efforts to limit the temperature increase to 1.5 °C […]".
cf. Article 2.1.a of the Paris Agreement
As part of the SR15 assessment, an ensemble of quantitative, model-based scenarios was compiled to underpin the scientific analysis. Many of the headline statements widely reported by media are based on this scenario ensemble, including the finding that
global net anthropogenic CO2 emissions decline by ~45% from 2010 levels by 2030
in all pathways limiting global warming to 1.5°C
(cf. statement C.1 in the Summary For Policymakers).
Open-source notebooks for transparency and reproducibility of the assessment
When preparing the SR15, the authors wanted to go beyond previous reports not just regarding the scientific rigor and scope of the analysis, but also establish new standards in terms of openness, transparency and reproducibility.
The scenario ensemble was made accessible via an interactive IAMC 1.5°C Scenario Explorer
(link) in line with the
FAIR principles for scientific data management and stewardship.
The process for compiling, validating and analyzing the scenario ensemble
was described in an open-access manuscript published in Nature Climate Change
(doi: 10.1038/s41558-018-0317-4).
In addition, the Jupyter notebooks generating many of the headline statements, tables and figures (using Matplotlib) were released under an open-source license to facilitate a better understanding of the analysis and enable reuse for subsequent research. The notebooks are available in rendered format and on GitHub.
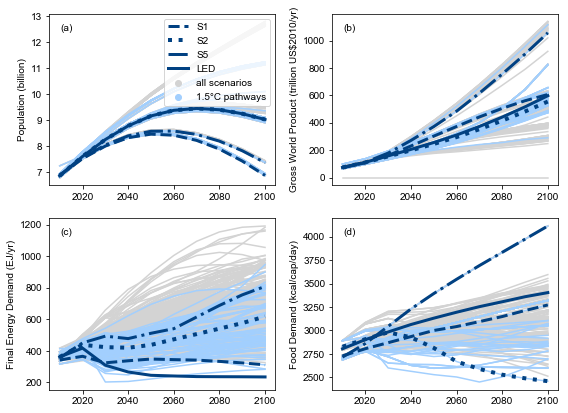
across the IAMC 1.5°C Scenario Ensemble
Drawn with Matplotlib, source code available here
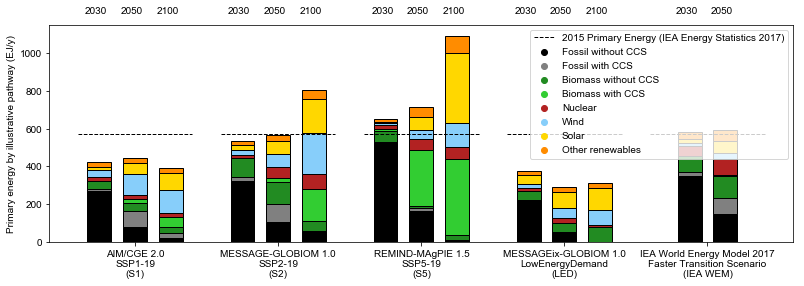
Drawn with Matplotlib, source code available here
A package for scenario analysis & visualization
To facilitate reusability of the scripts and plotting utilities developed for the SR15 analysis, we started the open-source Python package pyam as a toolbox for working with scenarios from integrated-assessment and energy system models.
The package is a wrapper for pandas and Matplotlib geared for several data formats commonly used in energy modelling. Read the docs!