Note
Click here to download the full example code
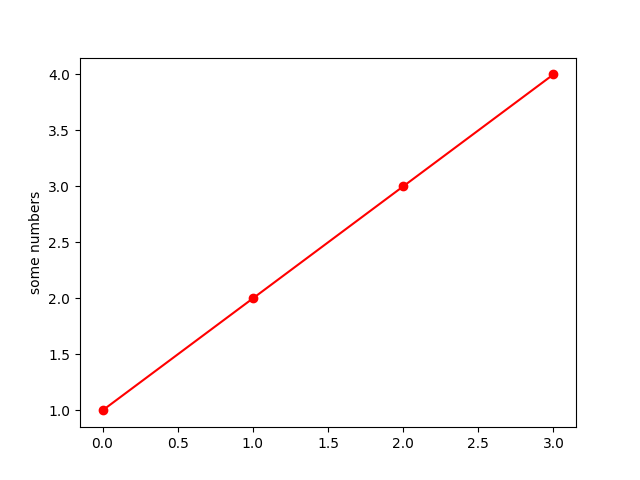
Pyplot Simple#
A very simple pyplot where a list of numbers are plotted against their index. Creates a straight line due to the rate of change being 1 for both the X and Y axis. Use a format string (here, 'o-r') to set the markers (circles), linestyle (solid line) and color (red).
import matplotlib.pyplot as plt

plt.plot([1, 2, 3, 4], 'o-r')
plt.ylabel('some numbers')
plt.show()
References
The use of the following functions, methods, classes and modules is shown in this example: