Note
Click here to download the full example code
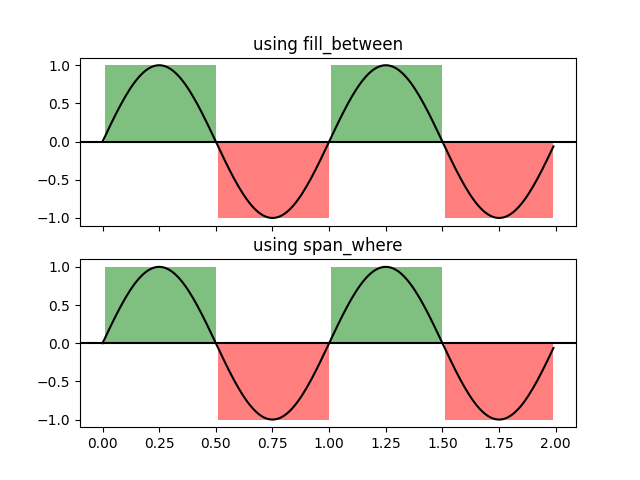
Shade regions defined by a logical mask using fill_between or span_where#
Shade regions where a logical mask is True with Axes.fill_between or with
matplotlib.collections.BrokenBarHCollection.span_where.
import numpy as np
import matplotlib.pyplot as plt
import matplotlib.collections as collections


t = np.arange(0.0, 2, 0.01)
s = np.sin(2*np.pi*t)

fig, axs = plt.subplots(2, sharex=True, sharey=True)
for ax in axs:
    ax.plot(t, s, color='black')
    ax.axhline(0, color='black')

axs[0].set_title('using fill_between')
axs[0].fill_between(t, 1, where=s > 0, facecolor='green', alpha=.5)
axs[0].fill_between(t, -1, where=s < 0, facecolor='red', alpha=.5)

axs[1].set_title('using span_where')
axs[1].add_collection(collections.BrokenBarHCollection.span_where(
    t, ymin=0, ymax=1, where=s > 0, facecolor='green', alpha=0.5))
axs[1].add_collection(collections.BrokenBarHCollection.span_where(
    t, ymin=-1, ymax=0, where=s < 0, facecolor='red', alpha=0.5))

plt.show()
References
The use of the following functions, methods, classes and modules is shown in this example: