What's new in Matplotlib 3.5.0 (Nov 15, 2021)#
For a list of all of the issues and pull requests since the last revision, see the GitHub statistics for 3.6.0 (Sep 15, 2022).
Figure and Axes creation / management#
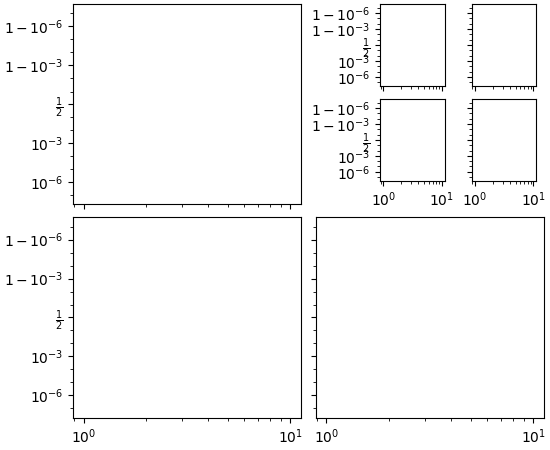
subplot_mosaic supports simple Axes sharing#
Figure.subplot_mosaic, pyplot.subplot_mosaic support simple Axes
sharing (i.e., only True/False may be passed to sharex/sharey). When
True, tick label visibility and Axis units will be shared.
mosaic = [
    ['A', [['B', 'C'],
           ['D', 'E']]],
    ['F', 'G'],
]
fig = plt.figure(constrained_layout=True)
ax_dict = fig.subplot_mosaic(mosaic, sharex=True, sharey=True)
# All Axes use these scales after this call.
ax_dict['A'].set(xscale='log', yscale='logit')
(Source code, png)

Figure now has draw_without_rendering method#
Some aspects of a figure are only determined at draw-time, such as the exact
position of text artists or deferred computation like automatic data limits.
If you need these values, you can use figure.canvas.draw() to force a full
draw. However, this has side effects, sometimes requires an open file, and is
doing more work than is needed.
The new Figure.draw_without_rendering method runs all the updates that
draw() does, but skips rendering the figure. It's thus more efficient if
you need the updated values to configure further aspects of the figure.
Figure __init__ passes keyword arguments through to set#
Similar to many other sub-classes of Artist, the FigureBase,
SubFigure, and Figure classes will now pass any additional keyword
arguments to set to allow properties of the newly created object to
be set at initialization time. For example:
from matplotlib.figure import Figure
fig = Figure(label='my figure')
Plotting methods#
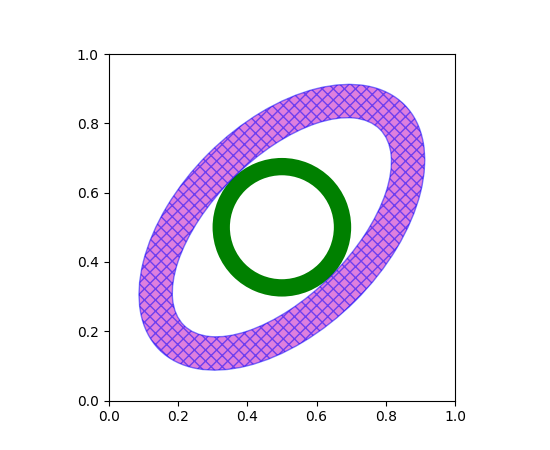
Add Annulus patch#
Annulus is a new class for drawing elliptical annuli.
(Source code, png)
set_data method for FancyArrow patch#
FancyArrow, the patch returned by ax.arrow, now has a set_data
method that allows modifying the arrow after creation, e.g., for animation.
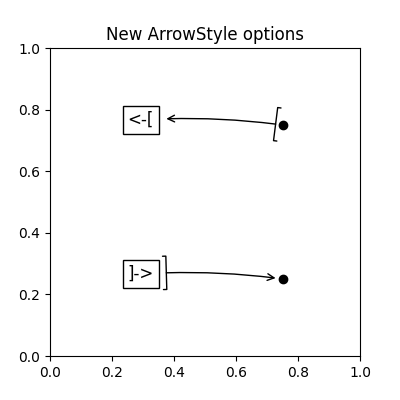
New arrow styles in ArrowStyle and ConnectionPatch#
The new arrow parameter to ArrowStyle substitutes the use of the
beginarrow and endarrow parameters in the creation of arrows. It receives
arrows strings like '<-', ']-[' and ']->' instead of individual
booleans.
Two new styles ']->' and '<-[' are also added via this mechanism.
ConnectionPatch, which accepts arrow styles though its arrowstyle
parameter, also accepts these new styles.
(Source code, png)

Setting collection offset transform after initialization#
The added collections.Collection.set_offset_transform may be used to set the
offset transform after initialization. This can be helpful when creating a
collections.Collection outside an Axes object, and later adding it with
Axes.add_collection() and setting the offset transform to Axes.transData.
Colors and colormaps#
Colormap registry (experimental)#
Colormaps are now managed via matplotlib.colormaps (or pyplot.colormaps),
which is a ColormapRegistry. While we are confident that the API is final,
we formally mark it as experimental for 3.5 because we want to keep the option
to still modify the API for 3.6 should the need arise.
Colormaps can be obtained using item access:
import matplotlib.pyplot as plt
cmap = plt.colormaps['viridis']
To register new colormaps use:
plt.colormaps.register(my_colormap)
We recommend to use the new API instead of the get_cmap and
register_cmap functions for new code. matplotlib.cm.get_cmap and
matplotlib.cm.register_cmap will eventually be deprecated and removed.
Within pyplot, plt.get_cmap() and plt.register_cmap() will continue
to be supported for backward compatibility.
Image interpolation now possible at RGBA stage#
Images in Matplotlib created via imshow are resampled to match
the resolution of the current canvas. It is useful to apply an auto-aliasing
filter when downsampling to reduce Moiré effects. By default, interpolation is
done on the data, a norm applied, and then the colormapping performed.
However, it is often desirable for the anti-aliasing interpolation to happen in RGBA space, where the colors are interpolated rather than the data. This usually leads to colors outside the colormap, but visually blends adjacent colors, and is what browsers and other image processing software do.
A new keyword argument interpolation_stage is provided for
imshow to set the stage at which the anti-aliasing interpolation
happens. The default is the current behaviour of "data", with the alternative
being "rgba" for the newly-available behavior.
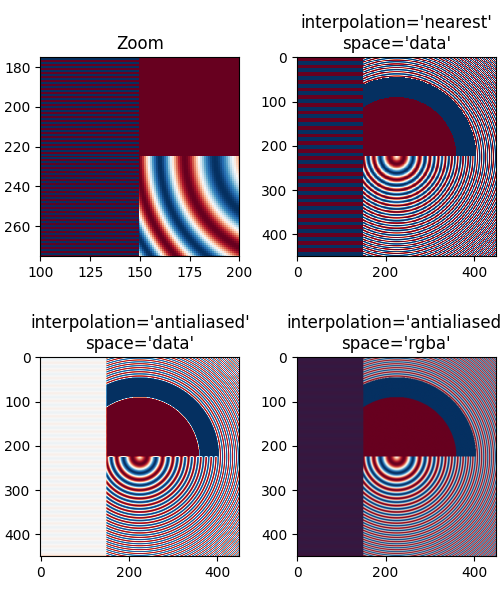
Example of the interpolation stage options.#
For more details see the discussion of the new keyword argument in Image antialiasing.
imshow supports half-float arrays#
The imshow method now supports half-float arrays, i.e., NumPy
arrays with dtype np.float16.
A callback registry has been added to Normalize objects#
colors.Normalize objects now have a callback registry, callbacks, that
can be connected to by other objects to be notified when the norm is updated.
The callback emits the key changed when the norm is modified.
cm.ScalarMappable is now a listener and will register a change when the
norm's vmin, vmax or other attributes are changed.
Titles, ticks, and labels#
Settings tick positions and labels simultaneously in set_ticks#
Axis.set_ticks (and the corresponding Axes.set_xticks /
Axes.set_yticks) has a new parameter labels allowing to set tick positions
and labels simultaneously.
Previously, setting tick labels was done using Axis.set_ticklabels (or
the corresponding Axes.set_xticklabels / Axes.set_yticklabels); this
usually only makes sense if tick positions were previously fixed with
set_ticks:
ax.set_xticks([1, 2, 3])
ax.set_xticklabels(['a', 'b', 'c'])
The combined functionality is now available in set_ticks:
ax.set_xticks([1, 2, 3], ['a', 'b', 'c'])
The use of Axis.set_ticklabels is discouraged, but it will stay available
for backward compatibility.
Note: This addition makes the API of set_ticks also more similar to
pyplot.xticks / pyplot.yticks, which already had the additional labels
parameter.
Fonts and Text#
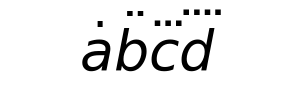
Triple and quadruple dot mathtext accents#
In addition to single and double dot accents, mathtext now supports triple and quadruple dot accents.
fig = plt.figure(figsize=(3, 1))
fig.text(0.5, 0.5, r'$\dot{a} \ddot{b} \dddot{c} \ddddot{d}$', fontsize=40,
         horizontalalignment='center', verticalalignment='center')
(Source code, png)

Font properties of legend title are configurable#
Title's font properties can be set via the title_fontproperties keyword argument, for example:
(Source code, png)
Text and TextBox added parse_math option#
Text and TextBox objects now allow a parse_math keyword-only argument
which controls whether math should be parsed from the displayed string. If
True, the string will be parsed as a math text object. If False, the string
will be considered a literal and no parsing will occur.
Text can be positioned inside TextBox widget#
A new parameter called textalignment can be used to control for the position
of the text inside the Axes of the TextBox widget.
(Source code, png)
Simplifying the font setting for usetex mode#
Now the rcParams["font.family"] (default: ['sans-serif']) accepts some font names as value for a more
user-friendly setup.
plt.rcParams.update({
    "text.usetex": True,
    "font.family": "Helvetica"
})
Type 42 subsetting is now enabled for PDF/PS backends#
backend_pdf and backend_ps now
use a unified Type 42 font subsetting interface, with the help of fontTools
Set rcParams["pdf.fonttype"] (default: 3) or rcParams["ps.fonttype"] (default: 3) to 42 to trigger this
workflow:
# for PDF backend
plt.rcParams['pdf.fonttype'] = 42

# for PS backend
plt.rcParams['ps.fonttype'] = 42

fig, ax = plt.subplots()
ax.text(0.4, 0.5, 'subsetted document is smaller in size!')

fig.savefig("document.pdf")
fig.savefig("document.ps")
rcParams improvements#
Allow setting default legend labelcolor globally#
A new rcParams["legend.labelcolor"] (default: 'None') sets the default labelcolor argument for
Figure.legend. The special values 'linecolor', 'markerfacecolor' (or
'mfc'), or 'markeredgecolor' (or 'mec') will cause the legend text to match the
corresponding color of marker.
(Source code, png)

3D Axes improvements#
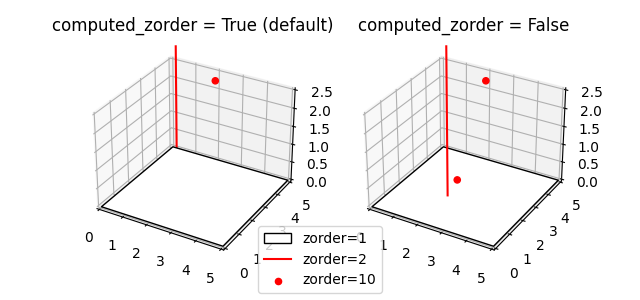
Axes3D now allows manual control of draw order#
The Axes3D class now has computed_zorder
parameter. When set to False, Artists are drawn using their zorder
attribute.
(Source code, png)
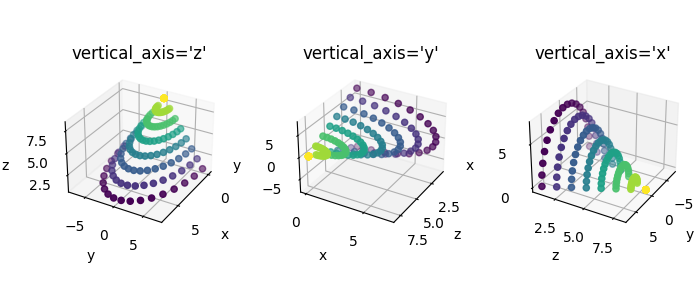
Allow changing the vertical axis in 3d plots#
view_init now has the parameter
vertical_axis which allows switching which axis is aligned vertically.
(Source code, png)

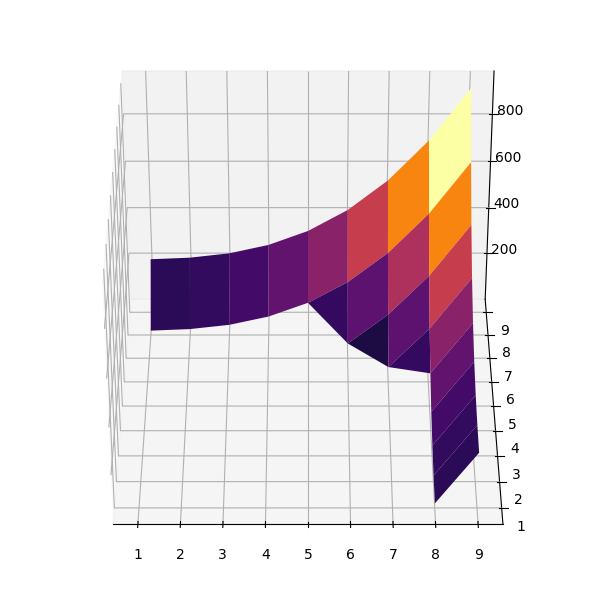
plot_surface supports masked arrays and NaNs#
axes3d.Axes3D.plot_surface supports masked arrays and NaNs, and will now
hide quads that contain masked or NaN points. The behaviour is similar to
Axes.contour with corner_mask=True.
(Source code, png)
3D plotting methods support data keyword argument#
To match all 2D plotting methods, the 3D Axes now support the data keyword argument. This allows passing arguments indirectly from a DataFrame-like structure.
data = {  # A labelled data set, or e.g., Pandas DataFrame.
    'x': ...,
    'y': ...,
    'z': ...,
    'width': ...,
    'depth': ...,
    'top': ...,
}

fig, ax = plt.subplots(subplot_kw={'projection': '3d')
ax.bar3d('x', 'y', 'z', 'width', 'depth', 'top', data=data)
Interactive tool improvements#
Colorbars now have pan and zoom functionality#
Interactive plots with colorbars can now be zoomed and panned on the colorbar
axis. This adjusts the vmin and vmax of the ScalarMappable associated
with the colorbar. This is currently only enabled for continuous norms. Norms
used with contourf and categoricals, such as BoundaryNorm and NoNorm,
have the interactive capability disabled by default. cb.ax.set_navigate()
can be used to set whether a colorbar axes is interactive or not.
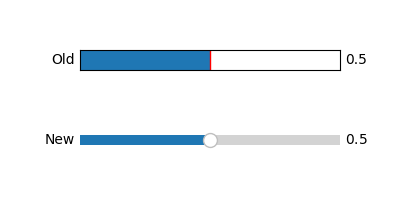
Updated the appearance of Slider widgets#
The appearance of Slider and RangeSlider widgets were updated and given
new styling parameters for the added handles.
(Source code, png)

Removing points on a PolygonSelector#
After completing a PolygonSelector, individual points can
now be removed by right-clicking on them.
Dragging selectors#
The SpanSelector, RectangleSelector
and EllipseSelector have a new keyword argument,
drag_from_anywhere, which when set to True allows you to click and drag
from anywhere inside the selector to move it. Previously it was only possible
to move it by either activating the move modifier button, or clicking on the
central handle.
The size of the SpanSelector can now be changed using the
edge handles.
Clearing selectors#
The selectors (EllipseSelector, LassoSelector,
PolygonSelector, RectangleSelector, and
SpanSelector) have a new method clear, which will clear the
current selection and get the selector ready to make a new selection. This is
equivalent to pressing the escape key.
Setting artist properties of selectors#
The artist properties of the EllipseSelector,
LassoSelector, PolygonSelector,
RectangleSelector and SpanSelector selectors can be
changed using the set_props and set_handle_props methods.
Ignore events outside selection#
The EllipseSelector, RectangleSelector and
SpanSelector selectors have a new keyword argument,
ignore_event_outside, which when set to True will ignore events outside of
the current selection. The handles or the new dragging functionality can instead
be used to change the selection.
CallbackRegistry objects gain a method to temporarily block signals#
The context manager blocked can be used
to block callback signals from being processed by the CallbackRegistry.
The optional keyword, signal, can be used to block a specific signal
from being processed and let all other signals pass.
import matplotlib.pyplot as plt

fig, ax = plt.subplots()
ax.imshow([[0, 1], [2, 3]])

# Block all interactivity through the canvas callbacks
with fig.canvas.callbacks.blocked():
    plt.show()

fig, ax = plt.subplots()
ax.imshow([[0, 1], [2, 3]])

# Only block key press events
with fig.canvas.callbacks.blocked(signal="key_press_event"):
    plt.show()
Directional sizing cursors#
Canvases now support setting directional sizing cursors, i.e., horizontal and vertical double arrows. These are used in e.g., selector widgets. Try the Mouse Cursor example to see the cursor in your desired backend.
Sphinx extensions#
More configuration of mathmpl sphinx extension#
The matplotlib.sphinxext.mathmpl sphinx extension supports two new
configuration options that may be specified in your conf.py:
mathmpl_fontsize(float), which sets the font size of the math text in points;mathmpl_srcset(list of str), which provides a list of sizes to support responsive resolution images The list should contain additional x-descriptors ('1.5x','2x', etc.) to generate (1x is the default and always included.)
Backend-specific improvements#
GTK backend#
A backend supporting GTK4 has been added. Both Agg and Cairo renderers are supported. The GTK4 backends may be selected as GTK4Agg or GTK4Cairo.
Qt backends#
Support for Qt6 (using either PyQt6 or PySide6) has been added, with either
the Agg or Cairo renderers. Simultaneously, support for Qt4 has been dropped.
Both Qt6 and Qt5 are supported by a combined backend (QtAgg or QtCairo), and
the loaded version is determined by modules already imported, the
QT_API environment variable, and available packages. See
How do I select the Qt implementation? for details. The versioned Qt5 backend names (Qt5Agg or
Qt5Cairo) remain supported for backwards compatibility.
HiDPI support in Cairo-based, GTK, and Tk backends#
The GTK3 backends now support HiDPI fully, including mixed monitor cases (on Wayland only). The newly added GTK4 backends also support HiDPI.
The TkAgg backend now supports HiDPI on Windows only, including mixed monitor cases.
All Cairo-based backends correctly support HiDPI as well as their Agg counterparts did (i.e., if the toolkit supports HiDPI, then the *Cairo backend will now support it, but not otherwise.)
Qt figure options editor improvements#
The figure options editor in the Qt backend now also supports editing the left
and right titles (plus the existing centre title). Editing Axis limits is
better supported when using a date converter. The symlog option is now
available in Axis scaling options. All entries with the same label are now
shown in the Curves tab.
WebAgg uses asyncio instead of Tornado#
The WebAgg backend defaults to using asyncio over Tornado for timer support.
This allows using the WebAgg backend in JupyterLite.
Version information#
We switched to the release-branch-semver version scheme of setuptools-scm. This only affects the version information for development builds. Their version number now describes the targeted release, i.e. 3.5.0.dev820+g6768ef8c4c is 820 commits after the previous release and is scheduled to be officially released as 3.5.0 later.
In addition to the string __version__, there is now a namedtuple
__version_info__ as well, which is modelled after sys.version_info. Its
primary use is safely comparing version information, e.g. if
__version_info__ >= (3, 4, 2).