Tutorials#
This page contains more in-depth guides for using Matplotlib. It is broken up into beginner, intermediate, and advanced sections, as well as sections covering specific topics.
For shorter examples, see our examples page. You can also find external resources and a FAQ in our user guide.
Introductory#
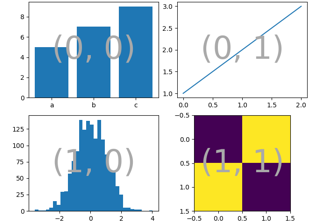
These tutorials cover the basics of creating visualizations with Matplotlib, as well as some best-practices in using the package effectively.
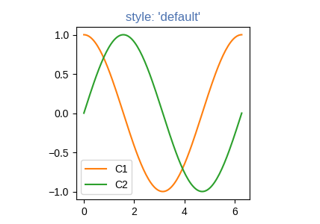
Customizing Matplotlib with style sheets and rcParams
Intermediate#
These tutorials cover some of the more complicated classes and functions in Matplotlib. They can be useful for particular custom and complex visualizations.
Advanced#
These tutorials cover advanced topics for experienced Matplotlib users and developers.
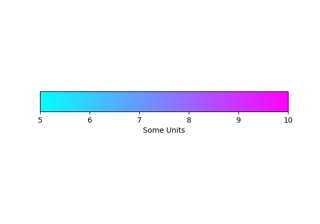
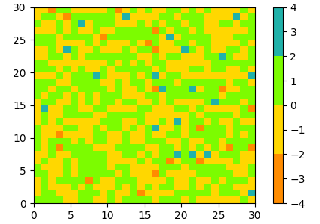
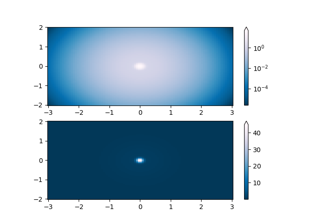
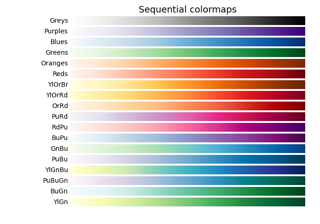
Colors#
Matplotlib has support for visualizing information with a wide array of colors and colormaps. These tutorials cover the basics of how these colormaps look, how you can create your own, and how you can customize colormaps for your use case.
For even more information see the examples page.
Provisional#
These tutorials cover proposed APIs of any complexity. These are here to document features that we have released, but want to get user feedback on before committing to them. Please have a look, try them out and give us feedback on gitter, discourse, or the the mailing list! But, be aware that we may change the APIs without warning in subsequent versions.
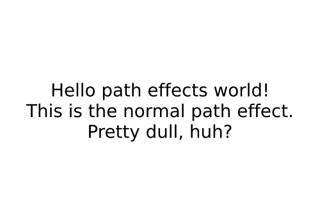
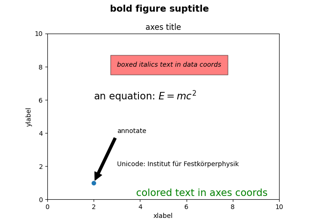
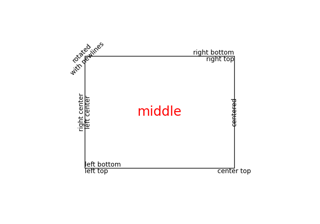
Text#
matplotlib has extensive text support, including support for mathematical expressions, truetype support for raster and vector outputs, newline separated text with arbitrary rotations, and Unicode support. These tutorials cover the basics of working with text in Matplotlib.

Text rendering with XeLaTeX/LuaLaTeX via the pgf backend

Toolkits#
These tutorials cover toolkits designed to extend the functionality of Matplotlib in order to accomplish specific goals.


