Note
Click here to download the full example code
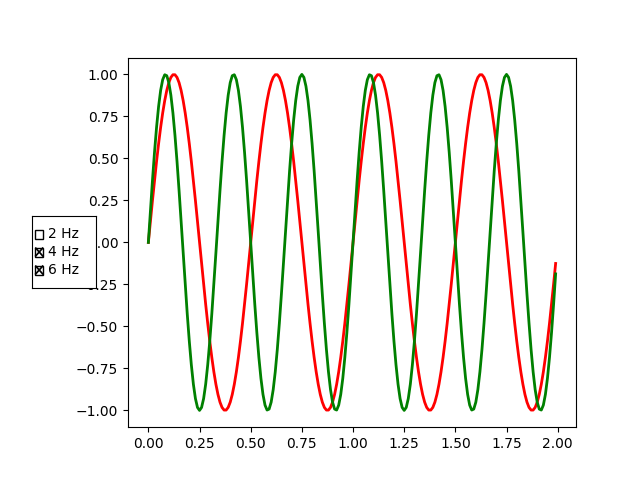
Check Buttons
Turning visual elements on and off with check buttons.
This program shows the use of 'Check Buttons' which is similar to check boxes. There are 3 different sine waves shown and we can choose which waves are displayed with the check buttons.
import numpy as np
import matplotlib.pyplot as plt
from matplotlib.widgets import CheckButtons

t = np.arange(0.0, 2.0, 0.01)
s0 = np.sin(2*np.pi*t)
s1 = np.sin(4*np.pi*t)
s2 = np.sin(6*np.pi*t)

fig, ax = plt.subplots()
l0, = ax.plot(t, s0, visible=False, lw=2, color='k', label='2 Hz')
l1, = ax.plot(t, s1, lw=2, color='r', label='4 Hz')
l2, = ax.plot(t, s2, lw=2, color='g', label='6 Hz')
plt.subplots_adjust(left=0.2)

lines = [l0, l1, l2]

# Make checkbuttons with all plotted lines with correct visibility
rax = plt.axes([0.05, 0.4, 0.1, 0.15])
labels = [str(line.get_label()) for line in lines]
visibility = [line.get_visible() for line in lines]
check = CheckButtons(rax, labels, visibility)


def func(label):
    index = labels.index(label)
    lines[index].set_visible(not lines[index].get_visible())
    plt.draw()

check.on_clicked(func)

plt.show()
Keywords: matplotlib code example, codex, python plot, pyplot Gallery generated by Sphinx-Gallery