Note
Click here to download the full example code
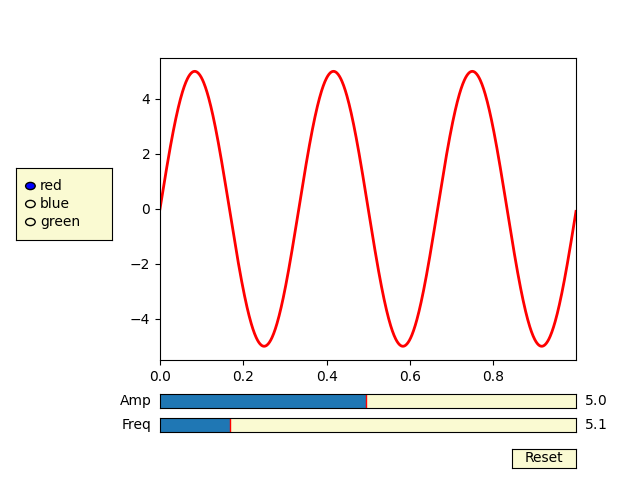
Slider Demo
Using the slider widget to control visual properties of your plot.
In this example, a slider is used to choose the frequency of a sine wave. You can control many continuously-varying properties of your plot in this way.
import numpy as np
import matplotlib.pyplot as plt
from matplotlib.widgets import Slider, Button, RadioButtons

fig, ax = plt.subplots()
plt.subplots_adjust(left=0.25, bottom=0.25)
t = np.arange(0.0, 1.0, 0.001)
a0 = 5
f0 = 3
delta_f = 5.0
s = a0 * np.sin(2 * np.pi * f0 * t)
l, = plt.plot(t, s, lw=2)
ax.margins(x=0)

axcolor = 'lightgoldenrodyellow'
axfreq = plt.axes([0.25, 0.1, 0.65, 0.03], facecolor=axcolor)
axamp = plt.axes([0.25, 0.15, 0.65, 0.03], facecolor=axcolor)

sfreq = Slider(axfreq, 'Freq', 0.1, 30.0, valinit=f0, valstep=delta_f)
samp = Slider(axamp, 'Amp', 0.1, 10.0, valinit=a0)


def update(val):
    amp = samp.val
    freq = sfreq.val
    l.set_ydata(amp*np.sin(2*np.pi*freq*t))
    fig.canvas.draw_idle()


sfreq.on_changed(update)
samp.on_changed(update)

resetax = plt.axes([0.8, 0.025, 0.1, 0.04])
button = Button(resetax, 'Reset', color=axcolor, hovercolor='0.975')


def reset(event):
    sfreq.reset()
    samp.reset()
button.on_clicked(reset)

rax = plt.axes([0.025, 0.5, 0.15, 0.15], facecolor=axcolor)
radio = RadioButtons(rax, ('red', 'blue', 'green'), active=0)


def colorfunc(label):
    l.set_color(label)
    fig.canvas.draw_idle()
radio.on_clicked(colorfunc)

# Initialize plot with correct initial active value
colorfunc(radio.value_selected)

plt.show()
Keywords: matplotlib code example, codex, python plot, pyplot Gallery generated by Sphinx-Gallery