Note
Click here to download the full example code
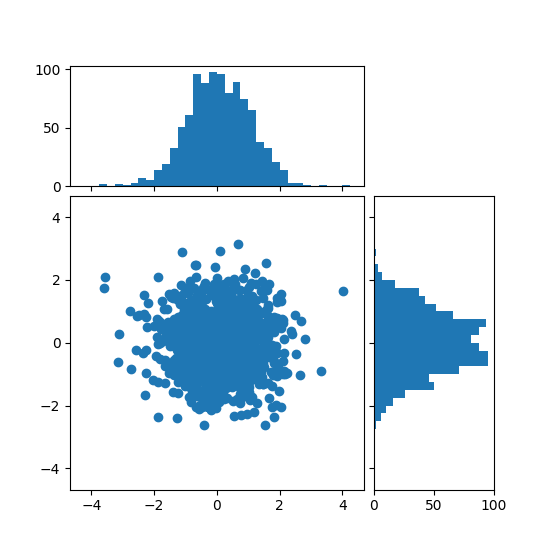
Scatter Histogram (Locatable Axes)
Show the marginal distributions of a scatter as histograms at the sides of the plot.
For a nice alignment of the main axes with the marginals, the axes positions
are defined by a Divider, produced via make_axes_locatable.
An alternative method to produce a similar figure is shown in the Scatter plot with histograms example. The advantage of the locatable axes method shown below is that the marginal axes follow the fixed aspect ratio of the main axes.
import numpy as np
import matplotlib.pyplot as plt
from mpl_toolkits.axes_grid1 import make_axes_locatable

# Fixing random state for reproducibility
np.random.seed(19680801)

# the random data
x = np.random.randn(1000)
y = np.random.randn(1000)


fig, ax = plt.subplots(figsize=(5.5, 5.5))

# the scatter plot:
ax.scatter(x, y)

# Set aspect of the main axes.
ax.set_aspect(1.)

# create new axes on the right and on the top of the current axes
divider = make_axes_locatable(ax)
# below height and pad are in inches
ax_histx = divider.append_axes("top", 1.2, pad=0.1, sharex=ax)
ax_histy = divider.append_axes("right", 1.2, pad=0.1, sharey=ax)

# make some labels invisible
ax_histx.xaxis.set_tick_params(labelbottom=False)
ax_histy.yaxis.set_tick_params(labelleft=False)

# now determine nice limits by hand:
binwidth = 0.25
xymax = max(np.max(np.abs(x)), np.max(np.abs(y)))
lim = (int(xymax/binwidth) + 1)*binwidth

bins = np.arange(-lim, lim + binwidth, binwidth)
ax_histx.hist(x, bins=bins)
ax_histy.hist(y, bins=bins, orientation='horizontal')

# the xaxis of ax_histx and yaxis of ax_histy are shared with ax,
# thus there is no need to manually adjust the xlim and ylim of these
# axis.

ax_histx.set_yticks([0, 50, 100])
ax_histy.set_xticks([0, 50, 100])

plt.show()
References
The use of the following functions, methods and classes is shown in this example:
import matplotlib
import mpl_toolkits
mpl_toolkits.axes_grid1.axes_divider.make_axes_locatable
matplotlib.axes.Axes.set_aspect
matplotlib.axes.Axes.scatter
matplotlib.axes.Axes.hist
Out:
<function Axes.hist at 0x7fba54b528b0>
Keywords: matplotlib code example, codex, python plot, pyplot Gallery generated by Sphinx-Gallery