Note
Click here to download the full example code
Boxplot Demo
Example boxplot code
import numpy as np
import matplotlib.pyplot as plt

# Fixing random state for reproducibility
np.random.seed(19680801)

# fake up some data
spread = np.random.rand(50) * 100
center = np.ones(25) * 50
flier_high = np.random.rand(10) * 100 + 100
flier_low = np.random.rand(10) * -100
data = np.concatenate((spread, center, flier_high, flier_low))
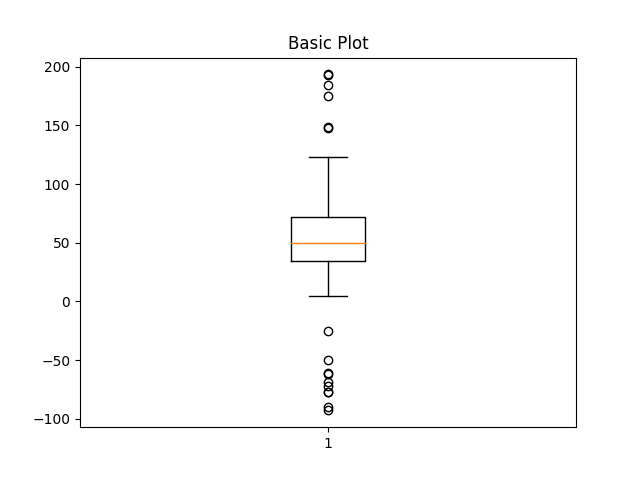
fig1, ax1 = plt.subplots()
ax1.set_title('Basic Plot')
ax1.boxplot(data)
Out:
{'whiskers': [<matplotlib.lines.Line2D object at 0x7f614db55910>, <matplotlib.lines.Line2D object at 0x7f614ee365b0>], 'caps': [<matplotlib.lines.Line2D object at 0x7f614ee36460>, <matplotlib.lines.Line2D object at 0x7f614ee36280>], 'boxes': [<matplotlib.lines.Line2D object at 0x7f614db552b0>], 'medians': [<matplotlib.lines.Line2D object at 0x7f614ee365e0>], 'fliers': [<matplotlib.lines.Line2D object at 0x7f614dc8ad00>], 'means': []}
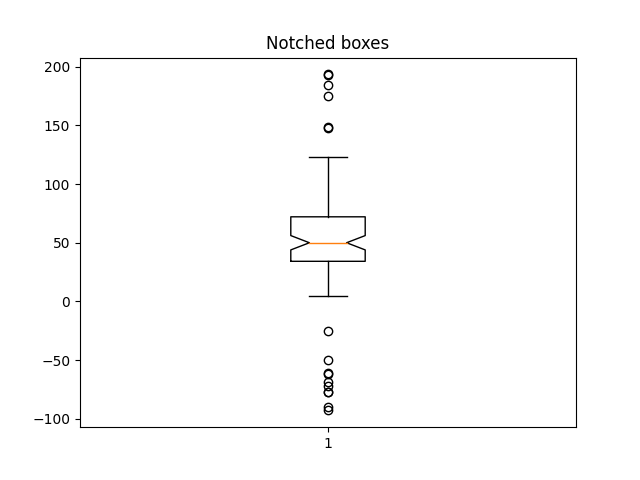
fig2, ax2 = plt.subplots()
ax2.set_title('Notched boxes')
ax2.boxplot(data, notch=True)
Out:
{'whiskers': [<matplotlib.lines.Line2D object at 0x7f614dafb040>, <matplotlib.lines.Line2D object at 0x7f614daf68e0>], 'caps': [<matplotlib.lines.Line2D object at 0x7f614daf6c40>, <matplotlib.lines.Line2D object at 0x7f614daf6fa0>], 'boxes': [<matplotlib.lines.Line2D object at 0x7f614dafba00>], 'medians': [<matplotlib.lines.Line2D object at 0x7f614ec30b80>], 'fliers': [<matplotlib.lines.Line2D object at 0x7f614db00610>], 'means': []}
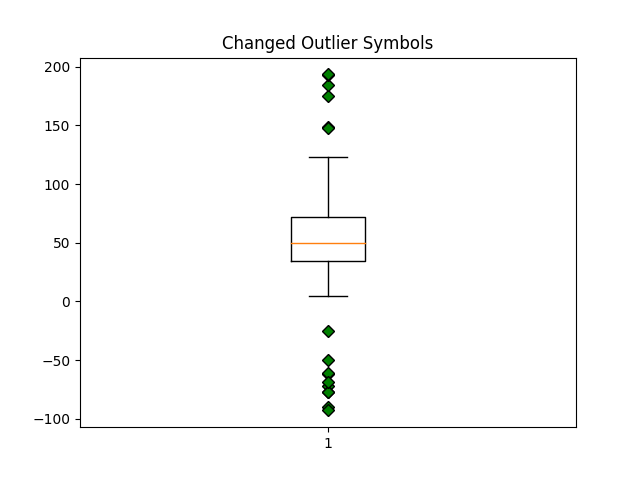
green_diamond = dict(markerfacecolor='g', marker='D')
fig3, ax3 = plt.subplots()
ax3.set_title('Changed Outlier Symbols')
ax3.boxplot(data, flierprops=green_diamond)
Out:
{'whiskers': [<matplotlib.lines.Line2D object at 0x7f614da1b880>, <matplotlib.lines.Line2D object at 0x7f614da1bbe0>], 'caps': [<matplotlib.lines.Line2D object at 0x7f614da1bf40>, <matplotlib.lines.Line2D object at 0x7f614d9f3ee0>], 'boxes': [<matplotlib.lines.Line2D object at 0x7f614da1b520>], 'medians': [<matplotlib.lines.Line2D object at 0x7f614d9f33d0>], 'fliers': [<matplotlib.lines.Line2D object at 0x7f614d9f3cd0>], 'means': []}
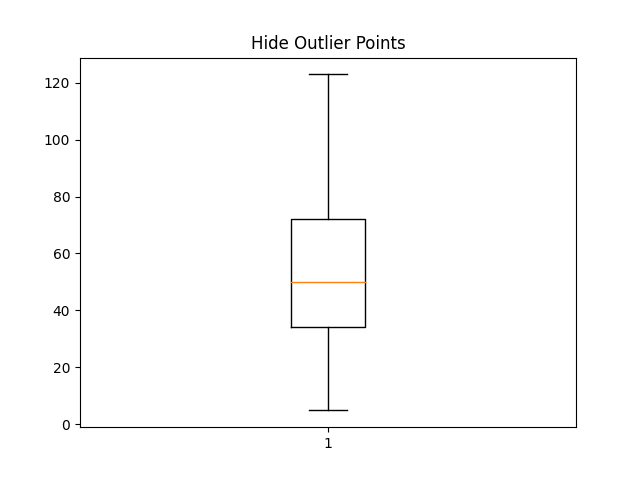
fig4, ax4 = plt.subplots()
ax4.set_title('Hide Outlier Points')
ax4.boxplot(data, showfliers=False)
Out:
{'whiskers': [<matplotlib.lines.Line2D object at 0x7f614da4b790>, <matplotlib.lines.Line2D object at 0x7f614da4baf0>], 'caps': [<matplotlib.lines.Line2D object at 0x7f614da4be50>, <matplotlib.lines.Line2D object at 0x7f614da421f0>], 'boxes': [<matplotlib.lines.Line2D object at 0x7f614da4b430>], 'medians': [<matplotlib.lines.Line2D object at 0x7f614da42520>], 'fliers': [], 'means': []}
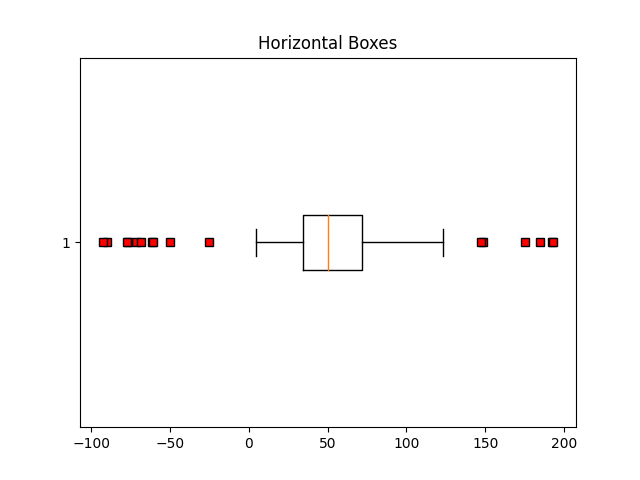
red_square = dict(markerfacecolor='r', marker='s')
fig5, ax5 = plt.subplots()
ax5.set_title('Horizontal Boxes')
ax5.boxplot(data, vert=False, flierprops=red_square)
Out:
{'whiskers': [<matplotlib.lines.Line2D object at 0x7f614daa76d0>, <matplotlib.lines.Line2D object at 0x7f614daa7a30>], 'caps': [<matplotlib.lines.Line2D object at 0x7f614daa7d90>, <matplotlib.lines.Line2D object at 0x7f614dacb130>], 'boxes': [<matplotlib.lines.Line2D object at 0x7f614daa7370>], 'medians': [<matplotlib.lines.Line2D object at 0x7f614dacb460>], 'fliers': [<matplotlib.lines.Line2D object at 0x7f614dacb760>], 'means': []}
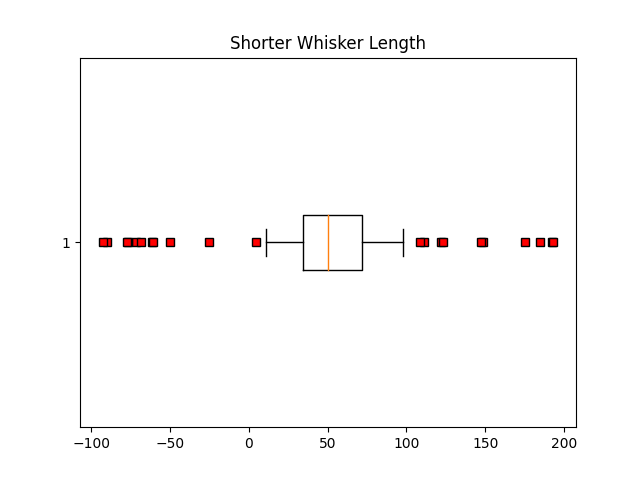
fig6, ax6 = plt.subplots()
ax6.set_title('Shorter Whisker Length')
ax6.boxplot(data, flierprops=red_square, vert=False, whis=0.75)
Out:
{'whiskers': [<matplotlib.lines.Line2D object at 0x7f614d9dd6d0>, <matplotlib.lines.Line2D object at 0x7f614d9dda30>], 'caps': [<matplotlib.lines.Line2D object at 0x7f614d9ddd90>, <matplotlib.lines.Line2D object at 0x7f614dc37130>], 'boxes': [<matplotlib.lines.Line2D object at 0x7f614d9dd370>], 'medians': [<matplotlib.lines.Line2D object at 0x7f614dc37460>], 'fliers': [<matplotlib.lines.Line2D object at 0x7f614dc37760>], 'means': []}
Fake up some more data
spread = np.random.rand(50) * 100
center = np.ones(25) * 40
flier_high = np.random.rand(10) * 100 + 100
flier_low = np.random.rand(10) * -100
d2 = np.concatenate((spread, center, flier_high, flier_low))
data.shape = (-1, 1)
d2.shape = (-1, 1)
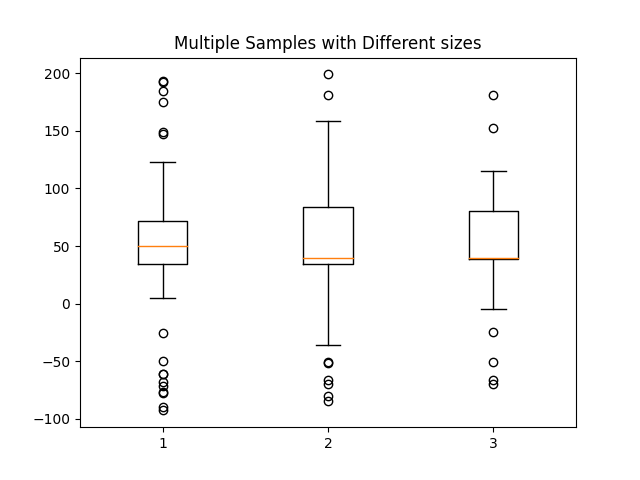
Making a 2-D array only works if all the columns are the same length. If they are not, then use a list instead. This is actually more efficient because boxplot converts a 2-D array into a list of vectors internally anyway.
data = [data, d2, d2[::2, 0]]
fig7, ax7 = plt.subplots()
ax7.set_title('Multiple Samples with Different sizes')
ax7.boxplot(data)

plt.show()
References
The use of the following functions, methods, classes and modules is shown in this example:
import matplotlib
matplotlib.axes.Axes.boxplot
matplotlib.pyplot.boxplot
Out:
<function boxplot at 0x7f61601a30d0>
Keywords: matplotlib code example, codex, python plot, pyplot Gallery generated by Sphinx-Gallery