matplotlib.pyplot.subplot
-
matplotlib.pyplot.subplot(*args, **kwargs)[source]¶ Add a subplot to the current figure.
Wrapper of
Figure.add_subplotwith a difference in behavior explained in the notes section.Call signatures:
subplot(nrows, ncols, index, **kwargs)
subplot(pos, **kwargs)
subplot(ax)
Parameters: - *args
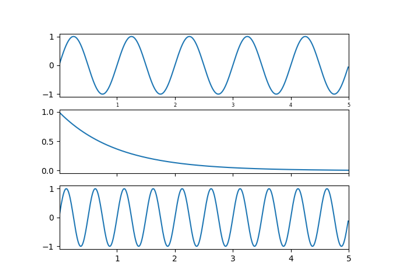
Either a 3-digit integer or three separate integers describing the position of the subplot. If the three integers are nrows, ncols, and index in order, the subplot will take the index position on a grid with nrows rows and ncols columns. index starts at 1 in the upper left corner and increases to the right.
pos is a three digit integer, where the first digit is the number of rows, the second the number of columns, and the third the index of the subplot. i.e. fig.add_subplot(235) is the same as fig.add_subplot(2, 3, 5). Note that all integers must be less than 10 for this form to work.
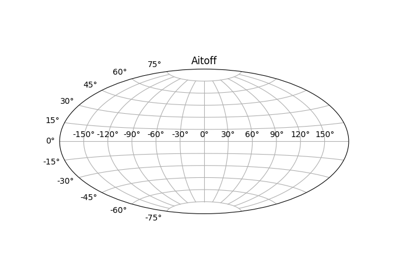
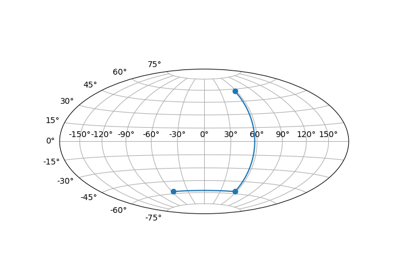
- projection{None, 'aitoff', 'hammer', 'lambert', 'mollweide', 'polar', 'rectilinear', str}, optional
The projection type of the subplot (
Axes). str is the name of a custom projection, seeprojections. The default None results in a 'rectilinear' projection.- polarboolean, optional
If True, equivalent to projection='polar'.
- sharex, sharey
Axes, optional Share the x or y
axiswith sharex and/or sharey. The axis will have the same limits, ticks, and scale as the axis of the shared axes.- labelstr
A label for the returned axes.
Returns: - axesan
axes.SubplotBasesubclass ofAxes(or a subclass ofAxes) The axes of the subplot. The returned axes base class depends on the projection used. It is
Axesif rectilinear projection are used andprojections.polar.PolarAxesif polar projection are used. The returned axes is then a subplot subclass of the base class.
Other Parameters: - **kwargs
This method also takes the keyword arguments for the returned axes base class; except for the figure argument. The keyword arguments for the rectilinear base class
Axescan be found in the following table but there might also be other keyword arguments if another projection is used.Property Description adjustable{'box', 'datalim'} agg_filtera filter function, which takes a (m, n, 3) float array and a dpi value, and returns a (m, n, 3) array alphafloat or None anchor2-tuple of floats or {'C', 'SW', 'S', 'SE', ...} animatedbool aspect{'auto', 'equal'} or num autoscale_onbool autoscalex_onbool autoscaley_onbool axes_locatorCallable[[Axes, Renderer], Bbox] axisbelowbool or 'line' clip_boxBboxclip_onbool clip_pathPatch or (Path, Transform) or None containscallable facecolorcolor fccolor figureFigureframe_onbool gidstr in_layoutbool labelobject navigatebool navigate_modeunknown path_effectsAbstractPathEffectpickerNone or bool or float or callable position[left, bottom, width, height] or Bboxprop_cycleunknown rasterization_zorderfloat or None rasterizedbool or None sketch_params(scale: float, length: float, randomness: float) snapbool or None titlestr transformTransformurlstr visiblebool xboundunknown xlabelstr xlim(bottom: float, top: float) xmarginfloat greater than -0.5 xscale{"linear", "log", "symlog", "logit", ...} xticklabelsList[str] xticksunknown yboundunknown ylabelstr ylim(bottom: float, top: float) ymarginfloat greater than -0.5 yscale{"linear", "log", "symlog", "logit", ...} yticklabelsList[str] yticksunknown zorderfloat
Notes
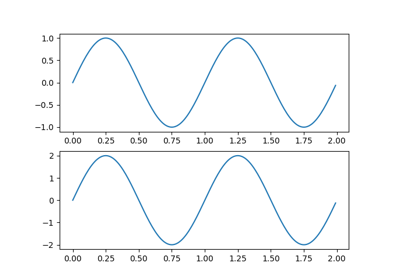
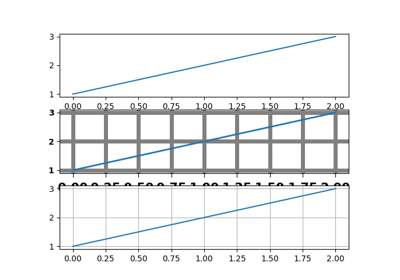
Creating a subplot will delete any pre-existing subplot that overlaps with it beyond sharing a boundary:
import matplotlib.pyplot as plt
# plot a line, implicitly creating a subplot(111)
plt.plot([1, 2, 3])
# now create a subplot which represents the top plot of a grid
# with 2 rows and 1 column. Since this subplot will overlap the
# first, the plot (and its axes) previously created, will be removed
plt.subplot(211)
If you do not want this behavior, use the
Figure.add_subplotmethod or thepyplot.axesfunction instead.If the figure already has a subplot with key (args, kwargs) then it will simply make that subplot current and return it. This behavior is deprecated. Meanwhile, if you do not want this behavior (i.e., you want to force the creation of a new subplot), you must use a unique set of args and kwargs. The axes label attribute has been exposed for this purpose: if you want two subplots that are otherwise identical to be added to the figure, make sure you give them unique labels.
In rare circumstances,
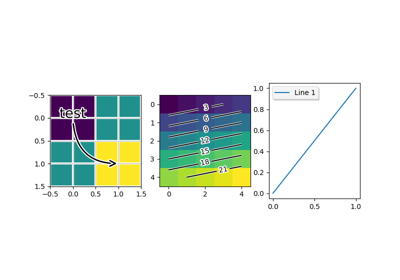
add_subplotmay be called with a single argument, a subplot axes instance already created in the present figure but not in the figure's list of axes.Examples
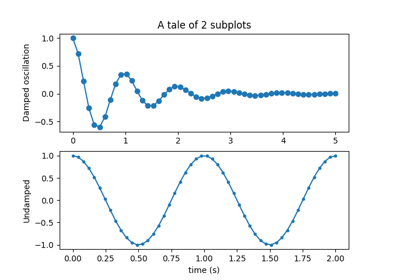
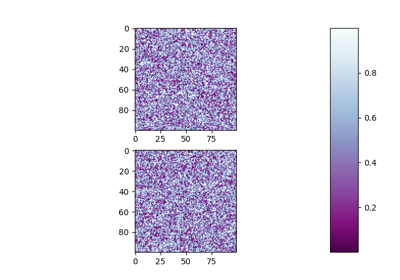
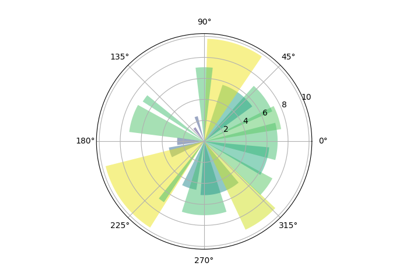
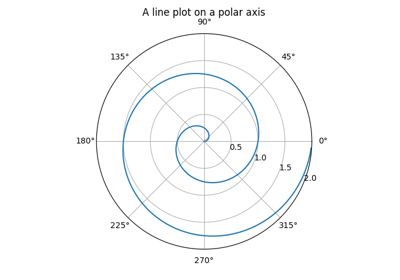
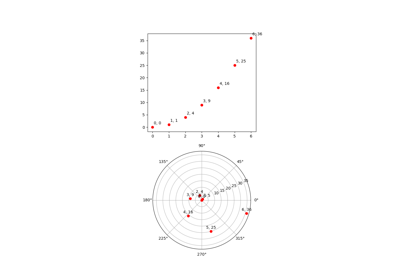
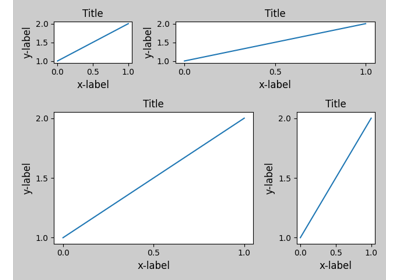
plt.subplot(221)

# equivalent but more general
ax1=plt.subplot(2, 2, 1)

# add a subplot with no frame
ax2=plt.subplot(222, frameon=False)

# add a polar subplot
plt.subplot(223, projection='polar')

# add a red subplot that shares the x-axis with ax1
plt.subplot(224, sharex=ax1, facecolor='red')

# delete ax2 from the figure
plt.delaxes(ax2)

# add ax2 to the figure again
plt.subplot(ax2)