matplotlib.pyplot.streamplot
-
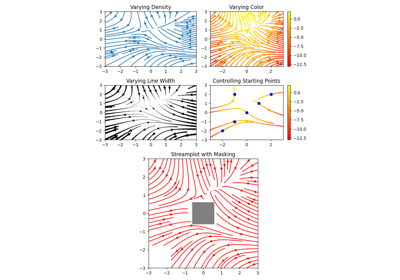
matplotlib.pyplot.streamplot(x, y, u, v, density=1, linewidth=None, color=None, cmap=None, norm=None, arrowsize=1, arrowstyle='-|>', minlength=0.1, transform=None, zorder=None, start_points=None, maxlength=4.0, integration_direction='both', *, data=None)[source]¶ Draw streamlines of a vector flow.
Parameters: - x, y1D arrays
An evenly spaced grid.
- u, v2D arrays
x and y-velocities. The number of rows and columns must match the length of y and x, respectively.
- densityfloat or (float, float)
Controls the closeness of streamlines. When
density = 1, the domain is divided into a 30x30 grid. density linearly scales this grid. Each cell in the grid can have, at most, one traversing streamline. For different densities in each direction, use a tuple (density_x, density_y).- linewidthfloat or 2D array
The width of the stream lines. With a 2D array the line width can be varied across the grid. The array must have the same shape as u and v.
- colormatplotlib color code, or 2D array
The streamline color. If given an array, its values are converted to colors using cmap and norm. The array must have the same shape as u and v.
- cmap
Colormap Colormap used to plot streamlines and arrows. This is only used if color is an array.
- norm
Normalize Normalize object used to scale luminance data to 0, 1. If
None, stretch (min, max) to (0, 1). This is only used if color is an array.- arrowsizefloat
Scaling factor for the arrow size.
- arrowstylestr
Arrow style specification. See
FancyArrowPatch.- minlengthfloat
Minimum length of streamline in axes coordinates.
- start_pointsNx2 array
Coordinates of starting points for the streamlines in data coordinates (the same coordinates as the x and y arrays).
- zorderint
The zorder of the stream lines and arrows. Artists with lower zorder values are drawn first.
- maxlengthfloat
Maximum length of streamline in axes coordinates.
- integration_direction{'forward', 'backward', 'both'}
Integrate the streamline in forward, backward or both directions. default is
'both'.
Returns: - stream_containerStreamplotSet
Container object with attributes
lines:LineCollectionof streamlinesarrows:PatchCollectioncontainingFancyArrowPatchobjects representing the arrows half-way along stream lines.
This container will probably change in the future to allow changes to the colormap, alpha, etc. for both lines and arrows, but these changes should be backward compatible.
Notes
Note
In addition to the above described arguments, this function can take a data keyword argument. If such a data argument is given, the following arguments are replaced by data[<arg>]:
- All arguments with the following names: 'start_points', 'u', 'v', 'x', 'y'.
Objects passed as data must support item access (
data[<arg>]) and membership test (<arg> in data).