matplotlib.pyplot.step
-
matplotlib.pyplot.step(x, y, *args, where='pre', data=None, **kwargs)[source]¶ Make a step plot.
Call signatures:
step(x, y, [fmt], *, data=None, where='pre', **kwargs)
step(x, y, [fmt], x2, y2, [fmt2], ..., *, where='pre', **kwargs)
This is just a thin wrapper around
plotwhich changes some formatting options. Most of the concepts and parameters of plot can be used here as well.Parameters: - xarray-like
1-D sequence of x positions. It is assumed, but not checked, that it is uniformly increasing.
- yarray-like
1-D sequence of y levels.
- fmtstr, optional
A format string, e.g. 'g' for a green line. See
plotfor a more detailed description.Note: While full format strings are accepted, it is recommended to only specify the color. Line styles are currently ignored (use the keyword argument linestyle instead). Markers are accepted and plotted on the given positions, however, this is a rarely needed feature for step plots.
- dataindexable object, optional
An object with labelled data. If given, provide the label names to plot in x and y.
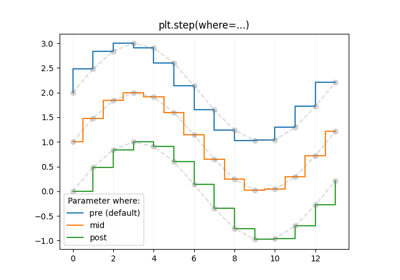
- where{'pre', 'post', 'mid'}, optional, default 'pre'
Define where the steps should be placed:
- 'pre': The y value is continued constantly to the left from
every x position, i.e. the interval
(x[i-1], x[i]]has the valuey[i]. - 'post': The y value is continued constantly to the right from
every x position, i.e. the interval
[x[i], x[i+1])has the valuey[i]. - 'mid': Steps occur half-way between the x positions.
- 'pre': The y value is continued constantly to the left from
every x position, i.e. the interval
Returns: - lines
A list of
Line2Dobjects representing the plotted data.
Other Parameters: - **kwargs
Additional parameters are the same as those for
plot.
Notes