matplotlib.pyplot.subplot2grid
-
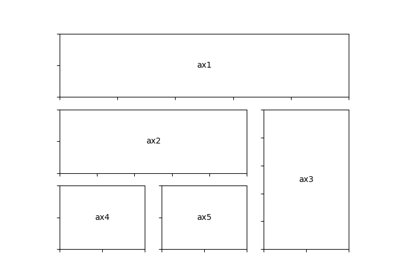
matplotlib.pyplot.subplot2grid(shape, loc, rowspan=1, colspan=1, fig=None, **kwargs)[source]¶ Create an axis at specific location inside a regular grid.
Parameters: - shapesequence of 2 ints
Shape of grid in which to place axis. First entry is number of rows, second entry is number of columns.
- locsequence of 2 ints
Location to place axis within grid. First entry is row number, second entry is column number.
- rowspanint
Number of rows for the axis to span to the right.
- colspanint
Number of columns for the axis to span downwards.
- fig
Figure, optional Figure to place axis in. Defaults to current figure.
- **kwargs
Additional keyword arguments are handed to
add_subplot.
Notes
The following call
subplot2grid(shape, loc, rowspan=1, colspan=1)
is identical to
gridspec=GridSpec(shape[0], shape[1])
subplotspec=gridspec.new_subplotspec(loc, rowspan, colspan)
subplot(subplotspec)