Version 3.1.2
Axes.set_xlim(self, left=None, right=None, emit=True, auto=False, *, xmin=None, xmax=None)¶Set the x-axis view limits.
| Parameters: |
|
|---|---|
| Returns: |
|
See also
Notes
The left value may be greater than the right value, in which case the x-axis values will decrease from left to right.
Examples
>>> set_xlim(left, right)
>>> set_xlim((left, right))
>>> left, right = set_xlim(left, right)
One limit may be left unchanged.
>>> set_xlim(right=right_lim)
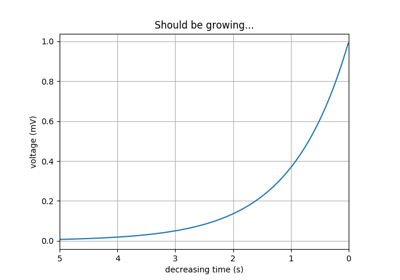
Limits may be passed in reverse order to flip the direction of the x-axis. For example, suppose x represents the number of years before present. The x-axis limits might be set like the following so 5000 years ago is on the left of the plot and the present is on the right.
>>> set_xlim(5000, 0)
matplotlib.axes.Axes.set_xlim