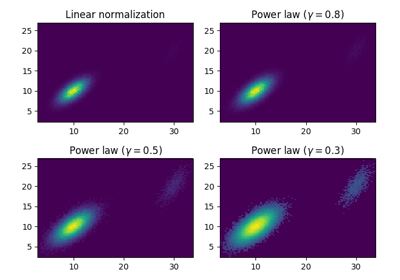
matplotlib.colors.PowerNorm
matplotlib.colors.
PowerNorm
Normalize a given value to the [0, 1] interval with a power-law scaling. This will clip any negative data points to 0.
[0, 1]
autoscale
Set vmin, vmax to min, max of A.
autoscale_None
autoscale only None-valued vmin or vmax.
inverse
Exploring normalizations
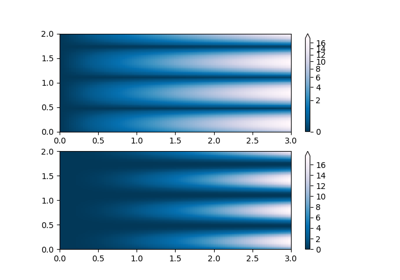
Shaded & power normalized rendering
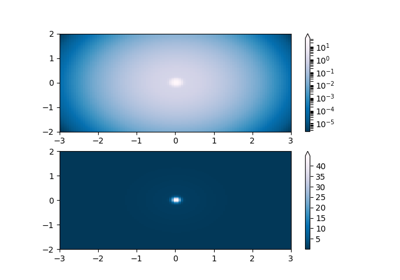
Colormap Normalizations Power
Colormap Normalizations
Colormap Normalization