Version 2.2.3
Note
Click here to download the full example code
Demonstration of using norm to map colormaps onto data in non-linear ways.
import numpy as np
import matplotlib.pyplot as plt
import matplotlib.colors as colors
N = 100
X, Y = np.mgrid[-3:3:complex(0, N), -2:2:complex(0, N)]
'''
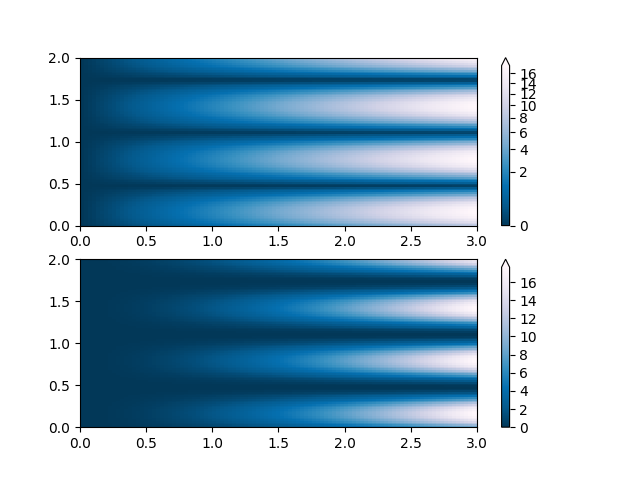
PowerNorm: Here a power-law trend in X partially obscures a rectified
sine wave in Y. We can remove the power law using a PowerNorm.
'''
X, Y = np.mgrid[0:3:complex(0, N), 0:2:complex(0, N)]
Z1 = (1 + np.sin(Y * 10.)) * X**(2.)
fig, ax = plt.subplots(2, 1)
pcm = ax[0].pcolormesh(X, Y, Z1, norm=colors.PowerNorm(gamma=1./2.),
cmap='PuBu_r')
fig.colorbar(pcm, ax=ax[0], extend='max')
pcm = ax[1].pcolormesh(X, Y, Z1, cmap='PuBu_r')
fig.colorbar(pcm, ax=ax[1], extend='max')
plt.show()
Keywords: matplotlib code example, codex, python plot, pyplot Gallery generated by Sphinx-Gallery