You are reading an old version of the documentation (v2.2.2). For the latest version see https://matplotlib.org/stable/api/_as_gen/matplotlib.pyplot.subplot2grid.html
Version 2.2.2
matplotlib
Fork me on GitHub

Table Of Contents

matplotlib.pyplot.subplot2grid

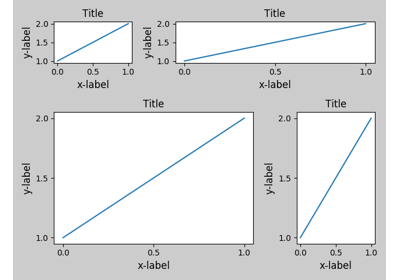
matplotlib.pyplot.subplot2grid(shape, loc, rowspan=1, colspan=1, fig=None, **kwargs)[source]

Create an axis at specific location inside a regular grid.

Parameters:
shape : sequence of 2 ints

Shape of grid in which to place axis. First entry is number of rows, second entry is number of columns.

loc : sequence of 2 ints

Location to place axis within grid. First entry is row number, second entry is column number.

rowspan : int

Number of rows for the axis to span to the right.

colspan : int

Number of columns for the axis to span downwards.

fig : Figure, optional

Figure to place axis in. Defaults to current figure.

**kwargs

Additional keyword arguments are handed to add_subplot.

Notes

The following call

subplot2grid(shape, loc, rowspan=1, colspan=1)

is identical to

gridspec=GridSpec(shape[0], shape[1])
subplotspec=gridspec.new_subplotspec(loc, rowspan, colspan)
subplot(subplotspec)

Examples using matplotlib.pyplot.subplot2grid