Version 2.2.2
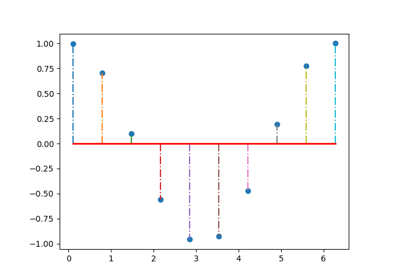
matplotlib.pyplot.stem(*args, **kwargs)[source]¶Create a stem plot.
A stem plot plots vertical lines at each x location from the baseline to y, and places a marker there.
Call signature:
stem([x,] y, linefmt=None, markerfmt=None, basefmt=None)
The x-positions are optional. The formats may be provided either as positional or as keyword-arguments.
| Parameters: |
|
||||||||||
|---|---|---|---|---|---|---|---|---|---|---|---|
| Returns: |
|
||||||||||
| Other Parameters: |
|
Notes
See also
The MATLAB function stem which inspired this method.
Note
In addition to the above described arguments, this function can take a data keyword argument. If such a data argument is given, the following arguments are replaced by data[<arg>]: