Version 2.2.2
Note
Click here to download the full example code
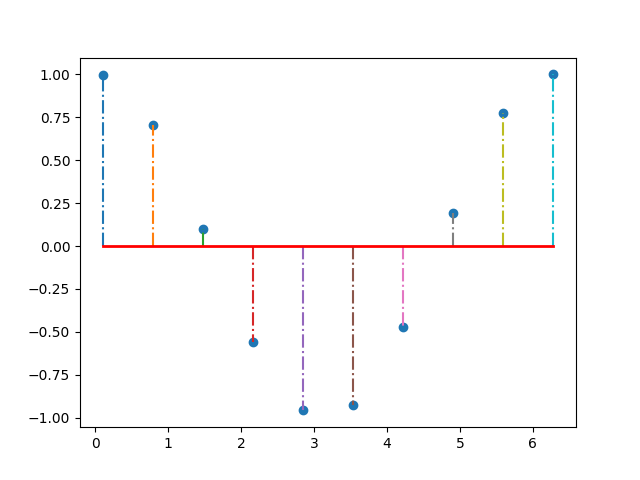
Example stem plot.
import matplotlib.pyplot as plt
import numpy as np

x = np.linspace(0.1, 2 * np.pi, 10)
markerline, stemlines, baseline = plt.stem(x, np.cos(x), '-.')
plt.setp(baseline, color='r', linewidth=2)

plt.show()
Keywords: matplotlib code example, codex, python plot, pyplot Gallery generated by Sphinx-Gallery