Version 2.1.2
Demo filled contour plots with hatched patterns.
import matplotlib.pyplot as plt
import numpy as np

# invent some numbers, turning the x and y arrays into simple
# 2d arrays, which make combining them together easier.
x = np.linspace(-3, 5, 150).reshape(1, -1)
y = np.linspace(-3, 5, 120).reshape(-1, 1)
z = np.cos(x) + np.sin(y)

# we no longer need x and y to be 2 dimensional, so flatten them.
x, y = x.flatten(), y.flatten()
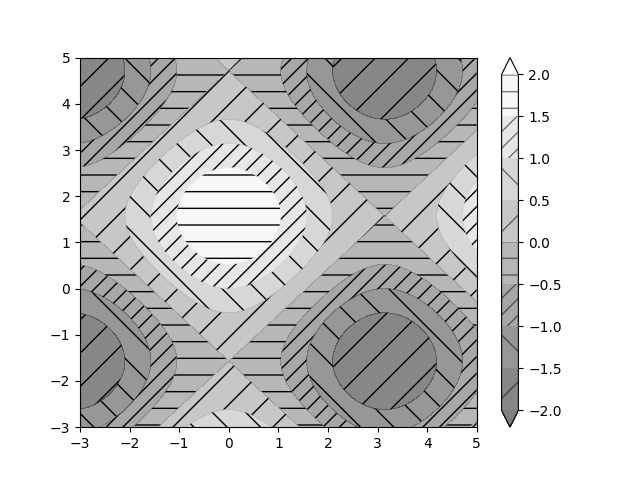
Plot 1: the simplest hatched plot with a colorbar
fig = plt.figure()
cs = plt.contourf(x, y, z, hatches=['-', '/', '\\', '//'],
                  cmap=plt.get_cmap('gray'),
                  extend='both', alpha=0.5
                  )
plt.colorbar()
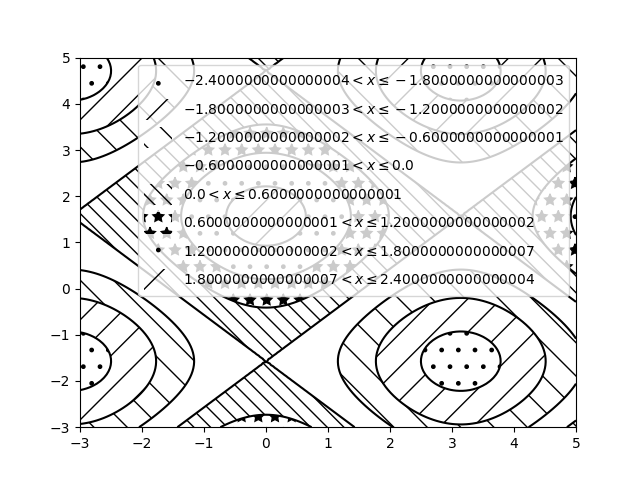
Plot 2: a plot of hatches without color with a legend
plt.figure()
n_levels = 6
plt.contour(x, y, z, n_levels, colors='black', linestyles='-')
cs = plt.contourf(x, y, z, n_levels, colors='none',
                  hatches=['.', '/', '\\', None, '\\\\', '*'],
                  extend='lower'
                  )

# create a legend for the contour set
artists, labels = cs.legend_elements()
plt.legend(artists, labels, handleheight=2)


plt.show()
Total running time of the script: ( 0 minutes 0.082 seconds)
