Version 2.1.2
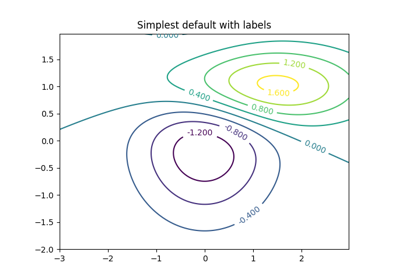
matplotlib.pyplot.contour(*args, **kwargs)¶Plot contours.
contour() and
contourf() draw contour lines and
filled contours, respectively. Except as noted, function
signatures and return values are the same for both versions.
contourf() differs from the MATLAB
version in that it does not draw the polygon edges.
To draw edges, add line contours with
calls to contour().
Call signatures:
contour(Z)
make a contour plot of an array Z. The level values are chosen automatically.
contour(X,Y,Z)
X, Y specify the (x, y) coordinates of the surface
contour(Z,N)
contour(X,Y,Z,N)
contour up to N automatically-chosen levels.
contour(Z,V)
contour(X,Y,Z,V)
draw contour lines at the values specified in sequence V, which must be in increasing order.
contourf(..., V)
fill the len(V)-1 regions between the values in V,
which must be in increasing order.
contour(Z, **kwargs)
Use keyword args to control colors, linewidth, origin, cmap … see below for more details.
X and Y must both be 2-D with the same shape as Z, or they
must both be 1-D such that len(X) is the number of columns in
Z and len(Y) is the number of rows in Z.
C = contour(...) returns a
QuadContourSet object.
Optional keyword arguments:
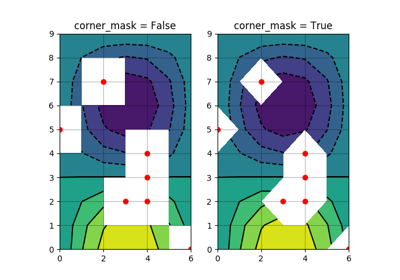
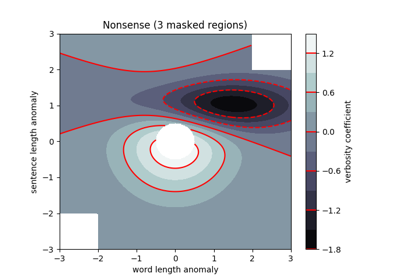
- corner_mask: [ True | False | ‘legacy’ ]
Enable/disable corner masking, which only has an effect if Z is a masked array. If False, any quad touching a masked point is masked out. If True, only the triangular corners of quads nearest those points are always masked out, other triangular corners comprising three unmasked points are contoured as usual. If ‘legacy’, the old contouring algorithm is used, which is equivalent to False and is deprecated, only remaining whilst the new algorithm is tested fully.
If not specified, the default is taken from rcParams[‘contour.corner_mask’], which is True unless it has been modified.
- colors: [ None | string | (mpl_colors) ]
If None, the colormap specified by cmap will be used.
If a string, like ‘r’ or ‘red’, all levels will be plotted in this color.
If a tuple of matplotlib color args (string, float, rgb, etc), different levels will be plotted in different colors in the order specified.
- alpha: float
- The alpha blending value
- cmap: [ None | Colormap ]
- A cm
Colormapinstance or None. If cmap is None and colors is None, a default Colormap is used.- norm: [ None | Normalize ]
- A
matplotlib.colors.Normalizeinstance for scaling data values to colors. If norm is None and colors is None, the default linear scaling is used.- vmin, vmax: [ None | scalar ]
- If not None, either or both of these values will be supplied to the
matplotlib.colors.Normalizeinstance, overriding the default color scaling based on levels.- levels: [level0, level1, …, leveln]
- A list of floating point numbers indicating the level curves to draw, in increasing order; e.g., to draw just the zero contour pass
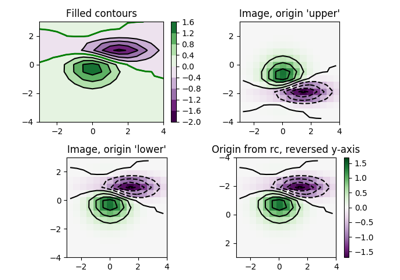
levels=[0]- origin: [ None | ‘upper’ | ‘lower’ | ‘image’ ]
If None, the first value of Z will correspond to the lower left corner, location (0,0). If ‘image’, the rc value for
image.originwill be used.This keyword is not active if X and Y are specified in the call to contour.
extent: [ None | (x0,x1,y0,y1) ]
If origin is not None, then extent is interpreted as in
matplotlib.pyplot.imshow(): it gives the outer pixel boundaries. In this case, the position of Z[0,0] is the center of the pixel, not a corner. If origin is None, then (x0, y0) is the position of Z[0,0], and (x1, y1) is the position of Z[-1,-1].This keyword is not active if X and Y are specified in the call to contour.
- locator: [ None | ticker.Locator subclass ]
- If locator is None, the default
MaxNLocatoris used. The locator is used to determine the contour levels if they are not given explicitly via the V argument.- extend: [ ‘neither’ | ‘both’ | ‘min’ | ‘max’ ]
- Unless this is ‘neither’, contour levels are automatically added to one or both ends of the range so that all data are included. These added ranges are then mapped to the special colormap values which default to the ends of the colormap range, but can be set via
matplotlib.colors.Colormap.set_under()andmatplotlib.colors.Colormap.set_over()methods.- xunits, yunits: [ None | registered units ]
- Override axis units by specifying an instance of a
matplotlib.units.ConversionInterface.- antialiased: [ True | False ]
- enable antialiasing, overriding the defaults. For filled contours, the default is True. For line contours, it is taken from rcParams[‘lines.antialiased’].
- nchunk: [ 0 | integer ]
- If 0, no subdivision of the domain. Specify a positive integer to divide the domain into subdomains of nchunk by nchunk quads. Chunking reduces the maximum length of polygons generated by the contouring algorithm which reduces the rendering workload passed on to the backend and also requires slightly less RAM. It can however introduce rendering artifacts at chunk boundaries depending on the backend, the antialiased flag and value of alpha.
contour-only keyword arguments:
- linewidths: [ None | number | tuple of numbers ]
If linewidths is None, the default width in
lines.linewidthinmatplotlibrcis used.If a number, all levels will be plotted with this linewidth.
If a tuple, different levels will be plotted with different linewidths in the order specified.
- linestyles: [ None | ‘solid’ | ‘dashed’ | ‘dashdot’ | ‘dotted’ ]
If linestyles is None, the default is ‘solid’ unless the lines are monochrome. In that case, negative contours will take their linestyle from the
matplotlibrccontour.negative_linestylesetting.linestyles can also be an iterable of the above strings specifying a set of linestyles to be used. If this iterable is shorter than the number of contour levels it will be repeated as necessary.
contourf-only keyword arguments:
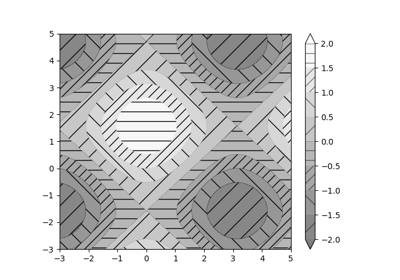
- hatches:
- A list of cross hatch patterns to use on the filled areas. If None, no hatching will be added to the contour. Hatching is supported in the PostScript, PDF, SVG and Agg backends only.
Note: contourf fills intervals that are closed at the top; that is, for boundaries z1 and z2, the filled region is:
z1 < z <= z2
There is one exception: if the lowest boundary coincides with the minimum value of the z array, then that minimum value will be included in the lowest interval.
matplotlib.pyplot.contour