Version 2.1.2
Illustrate some of the more advanced things that one can do with contour labels.
See also contour_demo.py.
import matplotlib
import numpy as np
import matplotlib.cm as cm
import matplotlib.mlab as mlab
import matplotlib.ticker as ticker
import matplotlib.pyplot as plt

matplotlib.rcParams['xtick.direction'] = 'out'
matplotlib.rcParams['ytick.direction'] = 'out'
Define our surface
delta = 0.025
x = np.arange(-3.0, 3.0, delta)
y = np.arange(-2.0, 2.0, delta)
X, Y = np.meshgrid(x, y)
Z1 = mlab.bivariate_normal(X, Y, 1.0, 1.0, 0.0, 0.0)
Z2 = mlab.bivariate_normal(X, Y, 1.5, 0.5, 1, 1)
# difference of Gaussians
Z = 10.0 * (Z2 - Z1)
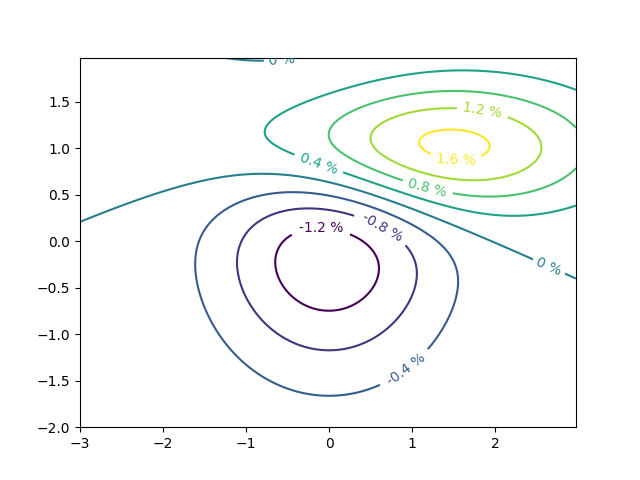
Make contour labels using creative float classes Follows suggestion of Manuel Metz
plt.figure()

# Basic contour plot
CS = plt.contour(X, Y, Z)


# Define a class that forces representation of float to look a certain way
# This remove trailing zero so '1.0' becomes '1'
class nf(float):
    def __repr__(self):
        str = '%.1f' % (self.__float__(),)
        if str[-1] == '0':
            return '%.0f' % self.__float__()
        else:
            return '%.1f' % self.__float__()


# Recast levels to new class
CS.levels = [nf(val) for val in CS.levels]

# Label levels with specially formatted floats
if plt.rcParams["text.usetex"]:
    fmt = r'%r \%%'
else:
    fmt = '%r %%'
plt.clabel(CS, CS.levels, inline=True, fmt=fmt, fontsize=10)
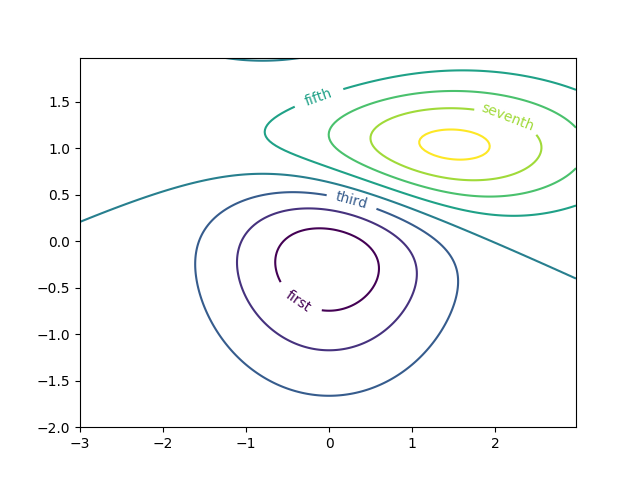
Label contours with arbitrary strings using a dictionary
plt.figure()

# Basic contour plot
CS = plt.contour(X, Y, Z)

fmt = {}
strs = ['first', 'second', 'third', 'fourth', 'fifth', 'sixth', 'seventh']
for l, s in zip(CS.levels, strs):
    fmt[l] = s

# Label every other level using strings
plt.clabel(CS, CS.levels[::2], inline=True, fmt=fmt, fontsize=10)
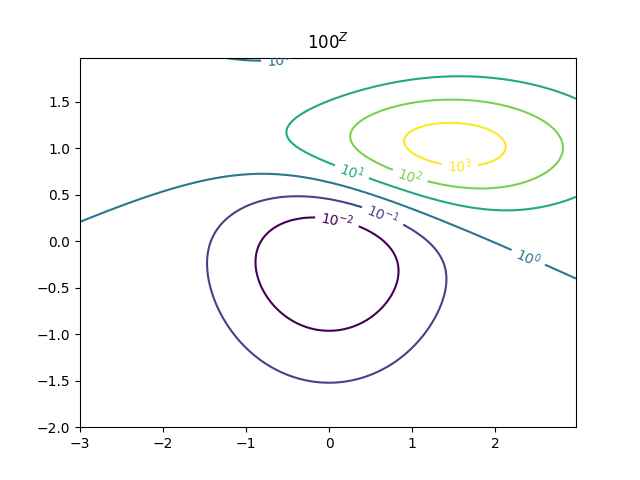
Use a Formatter
plt.figure()

CS = plt.contour(X, Y, 100**Z, locator=plt.LogLocator())
fmt = ticker.LogFormatterMathtext()
fmt.create_dummy_axis()
plt.clabel(CS, CS.levels, fmt=fmt)
plt.title("$100^Z$")

plt.show()
Total running time of the script: ( 0 minutes 0.129 seconds)
