Version 2.1.2
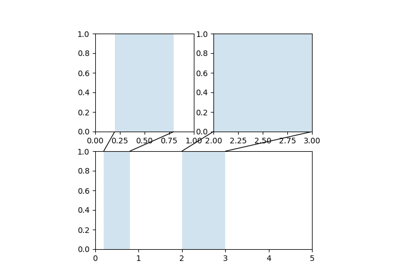
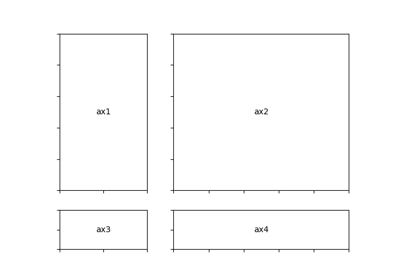
matplotlib.pyplot.subplot(*args, **kwargs)¶Return a subplot axes at the given grid position.
Call signature:
subplot(nrows, ncols, index, **kwargs)
In the current figure, create and return an Axes, at position index
of a (virtual) grid of nrows by ncols axes. Indexes go from 1 to
nrows * ncols, incrementing in row-major order.
If nrows, ncols and index are all less than 10, they can also be given as a single, concatenated, three-digit number.
For example, subplot(2, 3, 3) and subplot(233) both create an
Axes at the top right corner of the current figure, occupying half of
the figure height and a third of the figure width.
Note
Creating a subplot will delete any pre-existing subplot that overlaps with it beyond sharing a boundary:
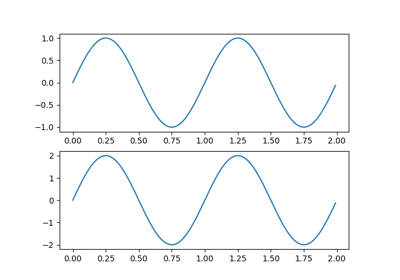
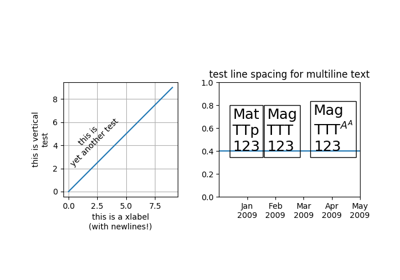
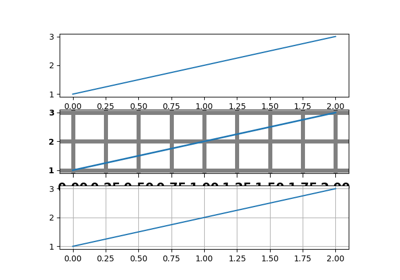
import matplotlib.pyplot as plt
# plot a line, implicitly creating a subplot(111)
plt.plot([1,2,3])
# now create a subplot which represents the top plot of a grid
# with 2 rows and 1 column. Since this subplot will overlap the
# first, the plot (and its axes) previously created, will be removed
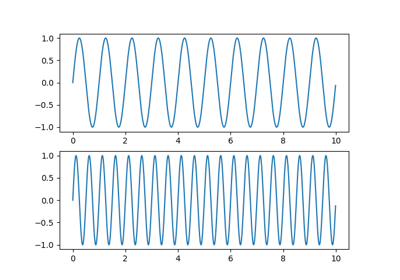
plt.subplot(211)
plt.plot(range(12))
plt.subplot(212, facecolor='y') # creates 2nd subplot with yellow background
If you do not want this behavior, use the
add_subplot() method or the
axes() function instead.
Keyword arguments:
- facecolor:
- The background color of the subplot, which can be any valid color specifier. See
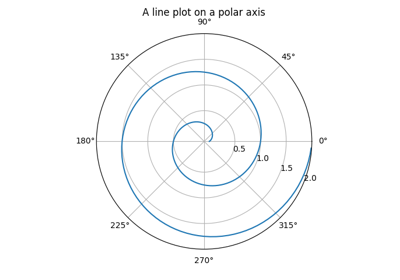
matplotlib.colorsfor more information.- polar:
- A boolean flag indicating whether the subplot plot should be a polar projection. Defaults to False.
- projection:
- A string giving the name of a custom projection to be used for the subplot. This projection must have been previously registered. See
matplotlib.projections.
See also
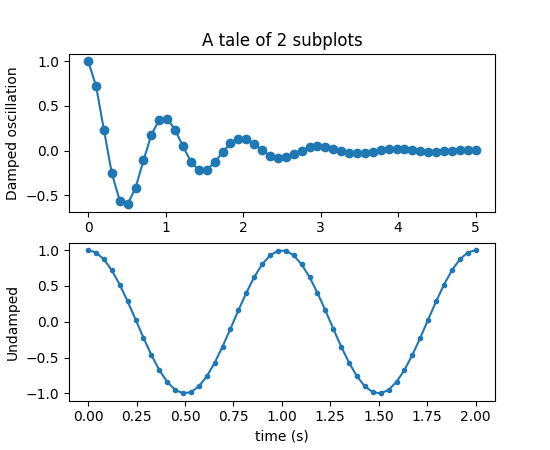
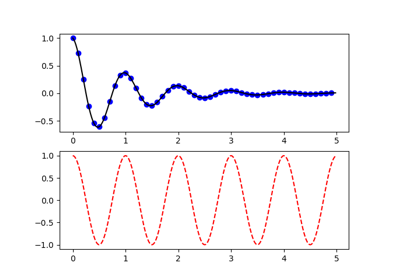
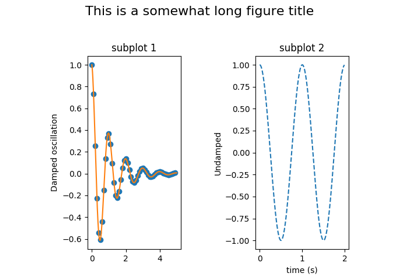
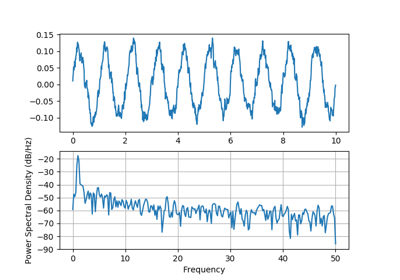
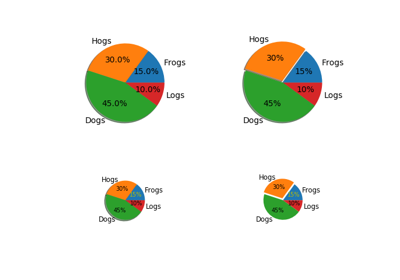
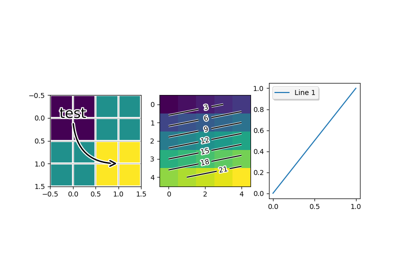
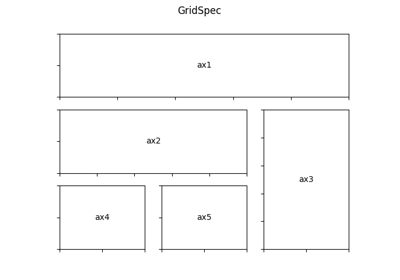
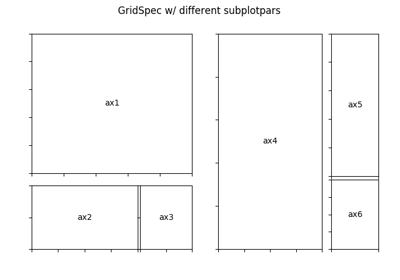
Example:
(Source code, png, pdf)
matplotlib.pyplot.subplot