You are reading an old version of the documentation (v2.1.1). For the latest version see https://matplotlib.org/stable/api/_as_gen/matplotlib.pyplot.axvspan.html
matplotlib
Fork me on GitHub


Travis-CI:

Table Of Contents

This Page

matplotlib.pyplot.axvspan

matplotlib.pyplot.axvspan(xmin, xmax, ymin=0, ymax=1, hold=None, **kwargs)

Add a vertical span (rectangle) across the axes.

Draw a vertical span (rectangle) from xmin to xmax. With the default values of ymin = 0 and ymax = 1. This always spans the yrange, regardless of the ylim settings, even if you change them, e.g., with the set_ylim() command. That is, the vertical extent is in axes coords: 0=bottom, 0.5=middle, 1.0=top but the y location is in data coordinates.

Parameters:

xmin : scalar

Number indicating the first X-axis coordinate of the vertical span rectangle in data units.

xmax : scalar

Number indicating the second X-axis coordinate of the vertical span rectangle in data units.

ymin : scalar, optional

Number indicating the first Y-axis coordinate of the vertical span rectangle in relative Y-axis units (0-1). Default to 0.

ymax : scalar, optional

Number indicating the second Y-axis coordinate of the vertical span rectangle in relative Y-axis units (0-1). Default to 1.

Returns:

rectangle : matplotlib.patches.Polygon

Vertical span (rectangle) from (xmin, ymin) to (xmax, ymax).

Other Parameters:
 

**kwargs

Optional parameters are properties of the class matplotlib.patches.Polygon.

See also

axhspan
add a horizontal span across the axes

Examples

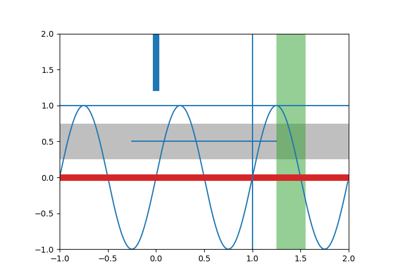
Draw a vertical, green, translucent rectangle from x = 1.25 to x = 1.55 that spans the yrange of the axes.

>>> axvspan(1.25, 1.55, facecolor='g', alpha=0.5)

Examples using matplotlib.pyplot.axvspan