matplotlib.pyplot.bar(*args, **kwargs)¶Make a bar plot.
Call signatures:
bar(x, height, *, align='center', **kwargs)
bar(x, height, width, *, align='center', **kwargs)
bar(x, height, width, bottom, *, align='center', **kwargs)
Make a bar plot with rectangles bounded by

(left, right, bottom and top edges) by default. x, height, width, and bottom can be either scalars or sequences.
The align and orientation kwargs control the interpretation of x and bottom
The align keyword-only argument controls if x is interpreted as the center or the left edge of the rectangle.
| Parameters: | x : sequence of scalars
height : scalar or sequence of scalars
width : scalar or array-like, optional
bottom : scalar or array-like, optional
align : {‘center’, ‘edge’}, optional, default: ‘center’
|
|---|---|
| Returns: | bars : matplotlib.container.BarContainer
|
| Other Parameters: | |
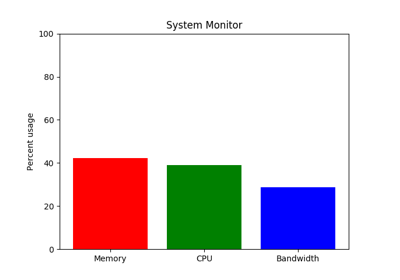
color : scalar or array-like, optional
edgecolor : scalar or array-like, optional
linewidth : scalar or array-like, optional
tick_label : string or array-like, optional
xerr : scalar or array-like, optional
yerr : scalar or array-like, optional
ecolor : scalar or array-like, optional
capsize : scalar, optional
error_kw : dict, optional
log : boolean, optional
orientation : {‘vertical’, ‘horizontal’}, optional
|
|
See also
barhNotes
The optional arguments color, edgecolor, linewidth,
xerr, and yerr can be either scalars or sequences of
length equal to the number of bars. This enables you to use
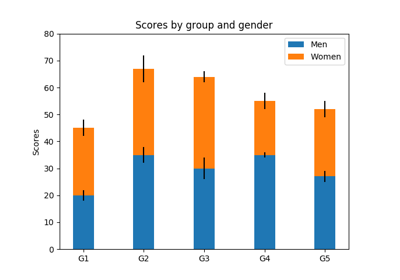
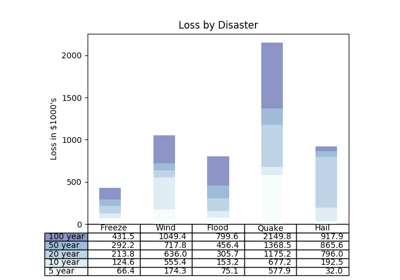
bar as the basis for stacked bar charts, or candlestick plots.
Detail: xerr and yerr are passed directly to
errorbar(), so they can also have shape 2xN for
independent specification of lower and upper errors.
Other optional kwargs:
Property Description agg_filtera filter function, which takes a (m, n, 3) float array and a dpi value, and returns a (m, n, 3) array alphafloat or None animatedbool antialiasedor aa[True | False] or None for default capstyle[‘butt’ | ‘round’ | ‘projecting’] clip_boxa Bboxinstanceclip_onbool clip_path[( Path,Transform) |Patch| None]colormatplotlib color spec containsa callable function edgecoloror ecmpl color spec, None, ‘none’, or ‘auto’ facecoloror fcmpl color spec, or None for default, or ‘none’ for no color figurea Figureinstancefill[True | False] gidan id string hatch[‘/’ | ‘' | ‘|’ | ‘-‘ | ‘+’ | ‘x’ | ‘o’ | ‘O’ | ‘.’ | ‘*’] joinstyle[‘miter’ | ‘round’ | ‘bevel’] labelobject linestyleor ls[‘solid’ | ‘dashed’, ‘dashdot’, ‘dotted’ | (offset, on-off-dash-seq) | '-'|'--'|'-.'|':'|'None'|' '|'']linewidthor lwfloat or None for default path_effectsAbstractPathEffectpicker[None | bool | float | callable] rasterizedbool or None sketch_params(scale: float, length: float, randomness: float) snapbool or None transformTransformurla url string visiblebool zorderfloat
Note
In addition to the above described arguments, this function can take a data keyword argument. If such a data argument is given, the following arguments are replaced by data[<arg>]:
matplotlib.pyplot.bar