Create lines or rectangles that span the axes in either the horizontal or vertical direction.
import numpy as np
import matplotlib.pyplot as plt
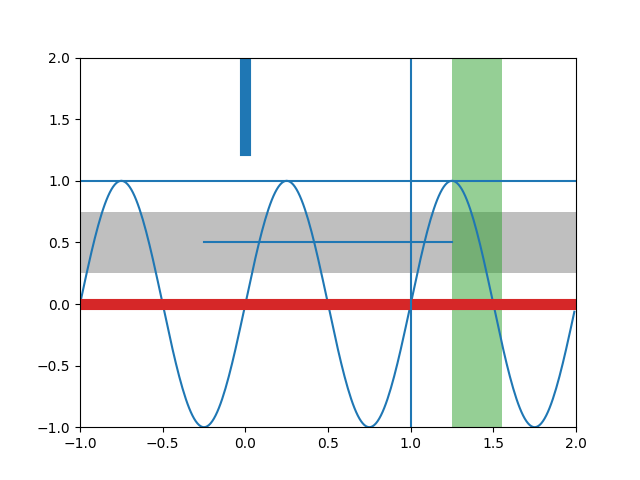
t = np.arange(-1, 2, .01)
s = np.sin(2 * np.pi * t)
plt.plot(t, s)
# Draw a thick red hline at y=0 that spans the xrange
plt.axhline(linewidth=8, color='#d62728')
# Draw a default hline at y=1 that spans the xrange
plt.axhline(y=1)
# Draw a default vline at x=1 that spans the yrange
plt.axvline(x=1)
# Draw a thick blue vline at x=0 that spans the upper quadrant of the yrange
plt.axvline(x=0, ymin=0.75, linewidth=8, color='#1f77b4')
# Draw a default hline at y=.5 that spans the middle half of the axes
plt.axhline(y=.5, xmin=0.25, xmax=0.75)
plt.axhspan(0.25, 0.75, facecolor='0.5', alpha=0.5)
plt.axvspan(1.25, 1.55, facecolor='#2ca02c', alpha=0.5)
plt.axis([-1, 2, -1, 2])
plt.show()
Total running time of the script: ( 0 minutes 0.078 seconds)
