Learn what to expect in the new updates

For a list of all of the issues and pull requests since the last revision, see the Github Stats.
Note
matplotlib 1.5 supports Python 2.7, 3.4, and 3.5
matplotlib 1.4 supports Python 2.6, 2.7, 3.3, and 3.4
matplotlib 1.3 supports Python 2.6, 2.7, 3.2, and 3.3
matplotlib 1.2 supports Python 2.6, 2.7, and 3.1
matplotlib 1.1 supports Python 2.4 to 2.7
Table of Contents
axes.prop_cycle key to rcParamsclose-figs argument for plot directiveimreadAll Artists now keep track of if their internal state has been
changed but not reflected in the display (‘stale’) by a call to
draw. It is thus possible to pragmatically determine if a given
Figure needs to be re-drawn in an interactive session.
To facilitate interactive usage a draw_all method has been added
to pyplot which will redraw all of the figures which are ‘stale’.
To make this convenient for interactive use matplotlib now registers
a function either with IPython’s ‘post_execute’ event or with the
displayhook in the standard python REPL to automatically call
plt.draw_all just before control is returned to the REPL. This ensures
that the draw command is deferred and only called once.
The upshot of this is that for interactive backends (including
%matplotlib notebook) in interactive mode (with plt.ion())
In [1]: import matplotlib.pyplot as plt

In [2]: fig, ax = plt.subplots()

In [3]: ln, = ax.plot([0, 1, 4, 9, 16])

In [4]: plt.show()

In [5]: ln.set_color('g')
will automatically update the plot to be green. Any subsequent
modifications to the Artist objects will do likewise.
This is the first step of a larger consolidation and simplification of the pyplot internals.
Plot methods which take arrays as inputs can now also work with labeled data and unpack such data.
This means that the following two examples produce the same plot:
Example
df = pandas.DataFrame({"var1":[1,2,3,4,5,6], "var2":[1,2,3,4,5,6]})
plt.plot(df["var1"], df["var2"])
Example
plt.plot("var1", "var2", data=df)
This works for most plotting methods, which expect arrays/sequences as
inputs. data can be anything which supports __getitem__
(dict, pandas.DataFrame, h5py, ...) to access array like
values with string keys.
In addition to this, some other changes were made, which makes working with
labeled data (ex pandas.Series) easier:
label keyword argument, one of the
data inputs is designated as the label source. If the user does not
supply a label that value object will be introspected for a
label, currently by looking for a name attribute. If the value
object does not have a name attribute but was specified by as a
key into the data kwarg, then the key is used. In the above
examples, this results in an implicit label="var2" for both
cases.plot() now uses the index of a Series instead of
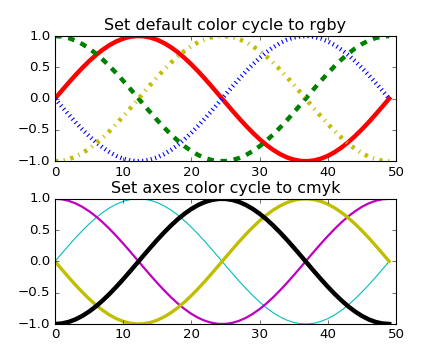
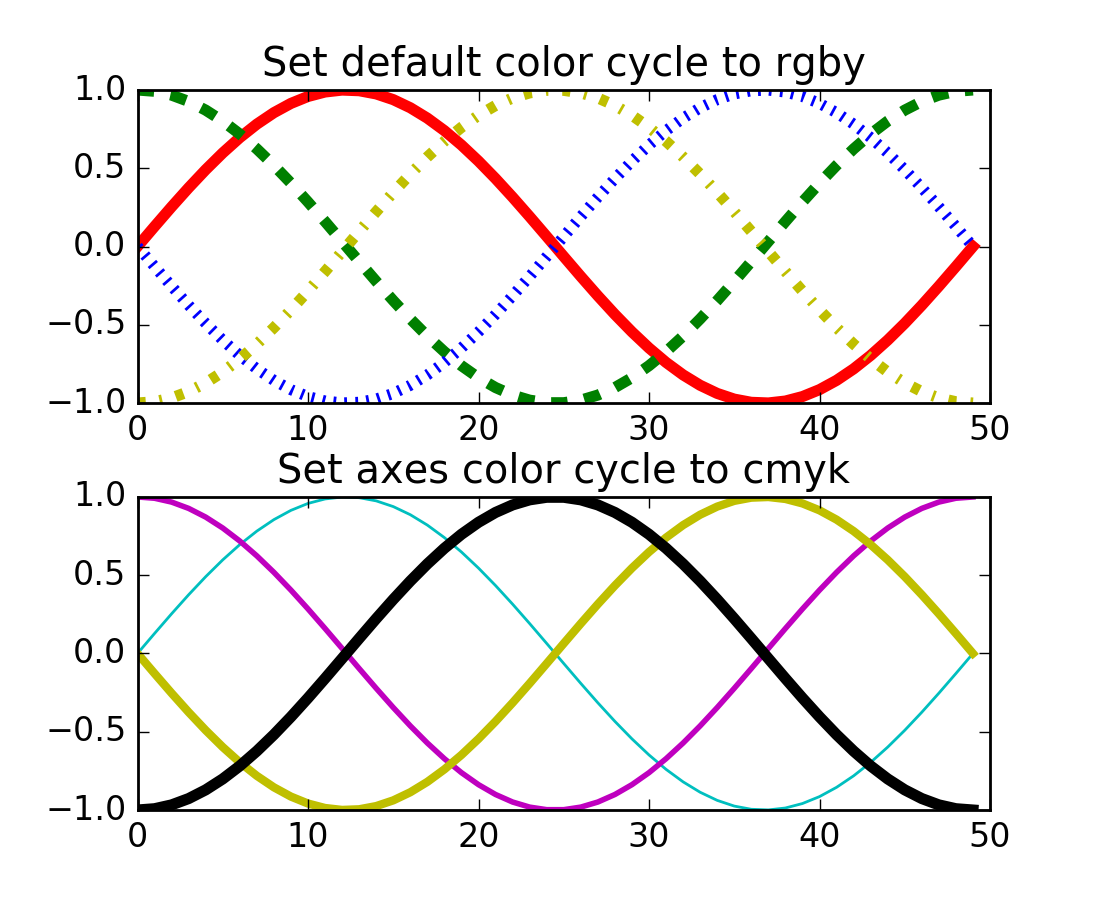
np.arange(len(y)), if no x argument is supplied.axes.prop_cycle key to rcParams¶This is a more generic form of the now-deprecated axes.color_cycle param.
Now, we can cycle more than just colors, but also linestyles, hatches,
and just about any other artist property. Cycler notation is used for
defining property cycles. Adding cyclers together will be like you are
zip()-ing together two or more property cycles together:
axes.prop_cycle: cycler('color', 'rgb') + cycler('lw', [1, 2, 3])
You can even multiply cyclers, which is like using itertools.product()
on two or more property cycles. Remember to use parentheses if writing
a multi-line prop_cycle parameter.
(Source code, png, hires.png, pdf)
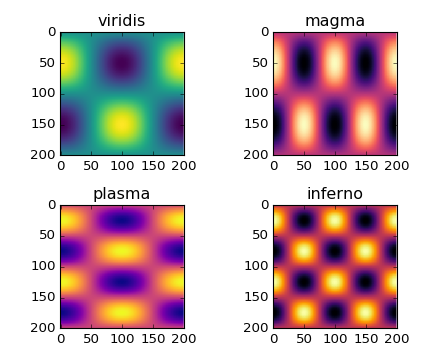
All four of the colormaps proposed as the new default are available
as 'viridis' (the new default in 2.0), 'magma', 'plasma', and
'inferno'
(Source code, png, hires.png, pdf)

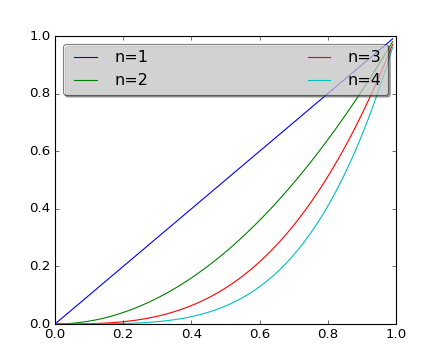
Several new styles have been added, including many styles from the Seaborn project. Additionally, in order to prep for the upcoming 2.0 style-change release, a ‘classic’ and ‘default’ style has been added. For this release, the ‘default’ and ‘classic’ styles are identical. By using them now in your scripts, you can help ensure a smooth transition during future upgrades of matplotlib, so that you can upgrade to the snazzy new defaults when you are ready!
import matplotlib.style
matplotlib.style.use('classic')
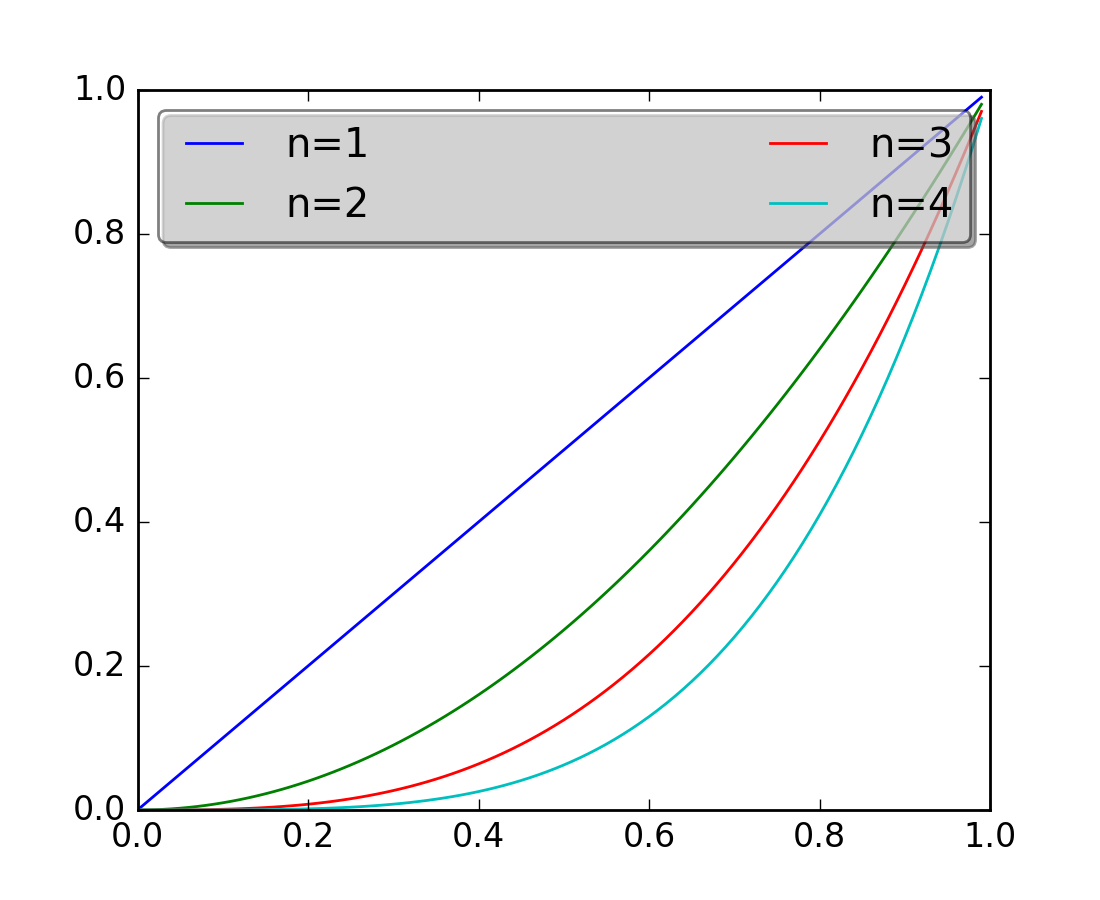
The ‘default’ style will give you matplotlib’s latest plotting styles:
matplotlib.style.use('default')
The environment variable MPLBACKEND can now be used to set the
matplotlib backend.
The wx backend can now be used with both wxPython classic and Phoenix.
wxPython classic has to be at least version 2.8.12 and works on Python 2.x. As of May 2015 no official release of wxPython Phoenix is available but a current snapshot will work on Python 2.7+ and 3.4+.
If you have multiple versions of wxPython installed, then the user code is
responsible setting the wxPython version. How to do this is
explained in the comment at the beginning of the example
examplesuser_interfacesembedding_in_wx2.py.
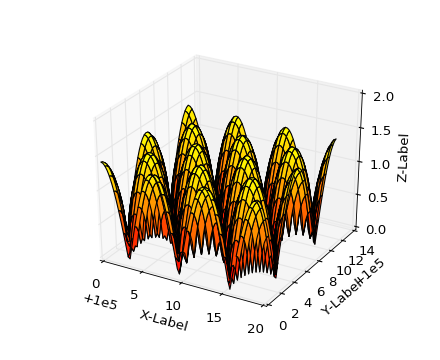
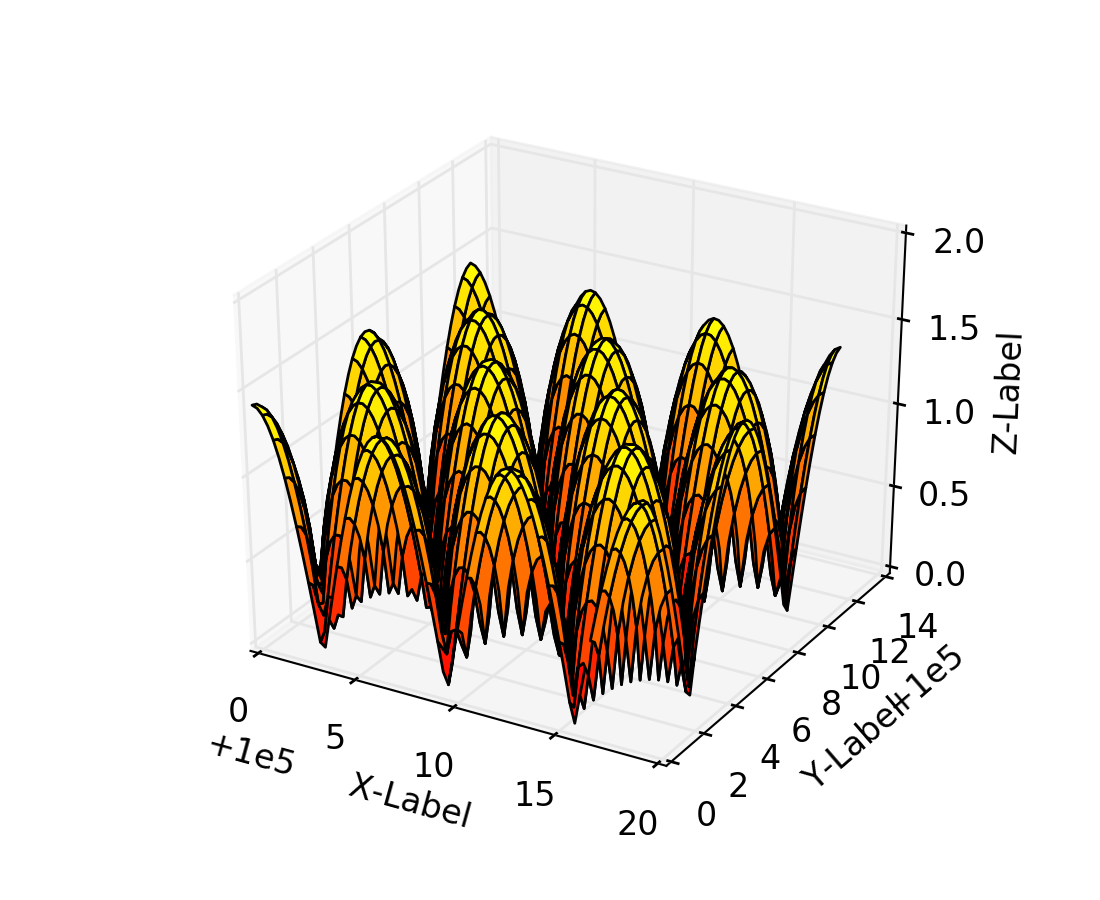
Some parameters have been added, others have been improved.
| Parameter | Description |
|---|---|
{x,y}axis.labelpad |
mplot3d now respects these parameters |
axes.labelpad |
Default space between the axis and the label |
errorbar.capsize |
Default length of end caps on error bars |
{x,y}tick.minor.visible |
Default visibility of minor x/y ticks |
legend.framealpha |
Default transparency of the legend frame box |
legend.facecolor |
Default facecolor of legend frame box (or
'inherit' from axes.facecolor) |
legend.edgecolor |
Default edgecolor of legend frame box (or
'inherit' from axes.edgecolor) |
figure.titlesize |
Default font size for figure suptitles |
figure.titleweight |
Default font weight for figure suptitles |
image.composite_image |
Whether a vector graphics backend should composite several images into a single image or not when saving. Useful when needing to edit the files further in Inkscape or other programs. |
markers.fillstyle |
Default fillstyle of markers. Possible values
are 'full' (the default), 'left',
'right', 'bottom', 'top' and
'none' |
toolbar |
Added 'toolmanager' as a valid value,
enabling the experimental ToolManager
feature. |
All selectors now implement set_active and get_active methods (also
called when accessing the active property) to properly update and query
whether they are active.
ignore, set_active, and get_active methods to base class Widget¶Pushes up duplicate methods in child class to parent class to avoid duplication of code.
A MultiCursor object can be disabled (and enabled) after it has been created without destroying the object. Example:
multi_cursor.active = False
Adds an interactive keyword which enables visible handles for manipulating the shape after it has been drawn.
Adds keyboard modifiers for:
Adds get_pixel_data and format_pixel_data methods to artists
which can be used to add zdata to the cursor display
in the status bar. Also adds an implementation for Images.
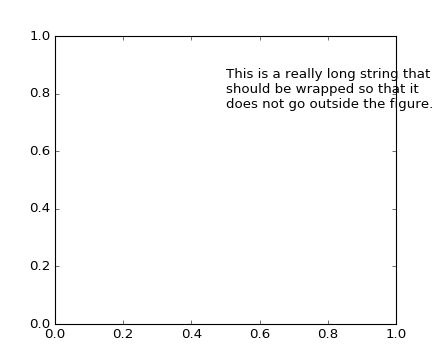
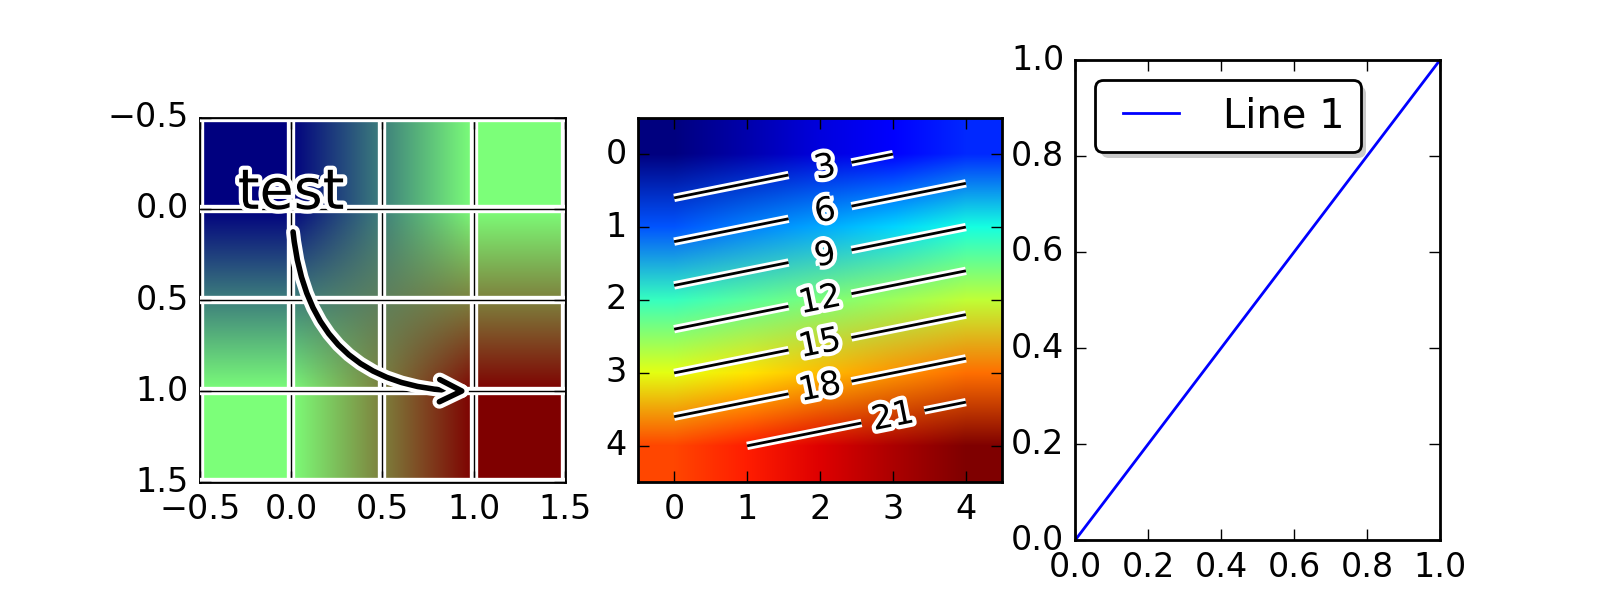
Added the keyword argument “wrap” to Text, which automatically breaks
long lines of text when being drawn. Works for any rotated text,
different modes of alignment, and for text that are either labels or
titles. This breaks at the Figure, not Axes edge.
(Source code, png, hires.png, pdf)

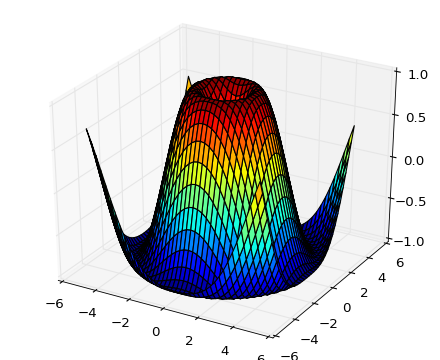
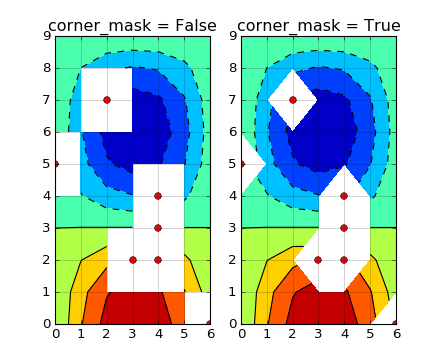
Ian Thomas rewrote the C++ code that calculates contours to add support for
corner masking. This is controlled by a new keyword argument
corner_mask in the functions contour() and
contourf(). The previous behaviour, which is now
obtained using corner_mask=False, was for a single masked point to
completely mask out all four quads touching that point. The new behaviour,
obtained using corner_mask=True, only masks the corners of those
quads touching the point; any triangular corners comprising three unmasked
points are contoured as usual. If the corner_mask keyword argument is not
specified, the default value is taken from rcParams.
(Source code, png, hires.png, pdf)

Line2D, Patch and Collection¶The handling of linestyles for Lines, Patches and Collections has been
unified. Now they all support defining linestyles with short symbols,
like "--", as well as with full names, like "dashed". Also the
definition using a dash pattern ((0., [3., 3.])) is supported for all
methods using Line2D, Patch or Collection.
Added ability to place the label before the marker in a legend box with
markerfirst keyword
Added a legend_handler for PolyCollection as well as a labels argument to
stackplot().
Added a pivot kwarg to quiver()
that controls the pivot point around which the quiver line rotates. This also
determines the placement of the arrow head along the quiver line.
Added support for the ‘logit’ axis scale, a nonlinear transformation

for data between 0 and 1 excluded.
Added step kwarg to Axes.fill_between to allow to fill between
lines drawn using the ‘step’ draw style. The values of step match
those of the where kwarg of Axes.step. The asymmetry of of the
kwargs names is not ideal, but Axes.fill_between already has a
where kwarg.
This is particularly useful for plotting pre-binned histograms.
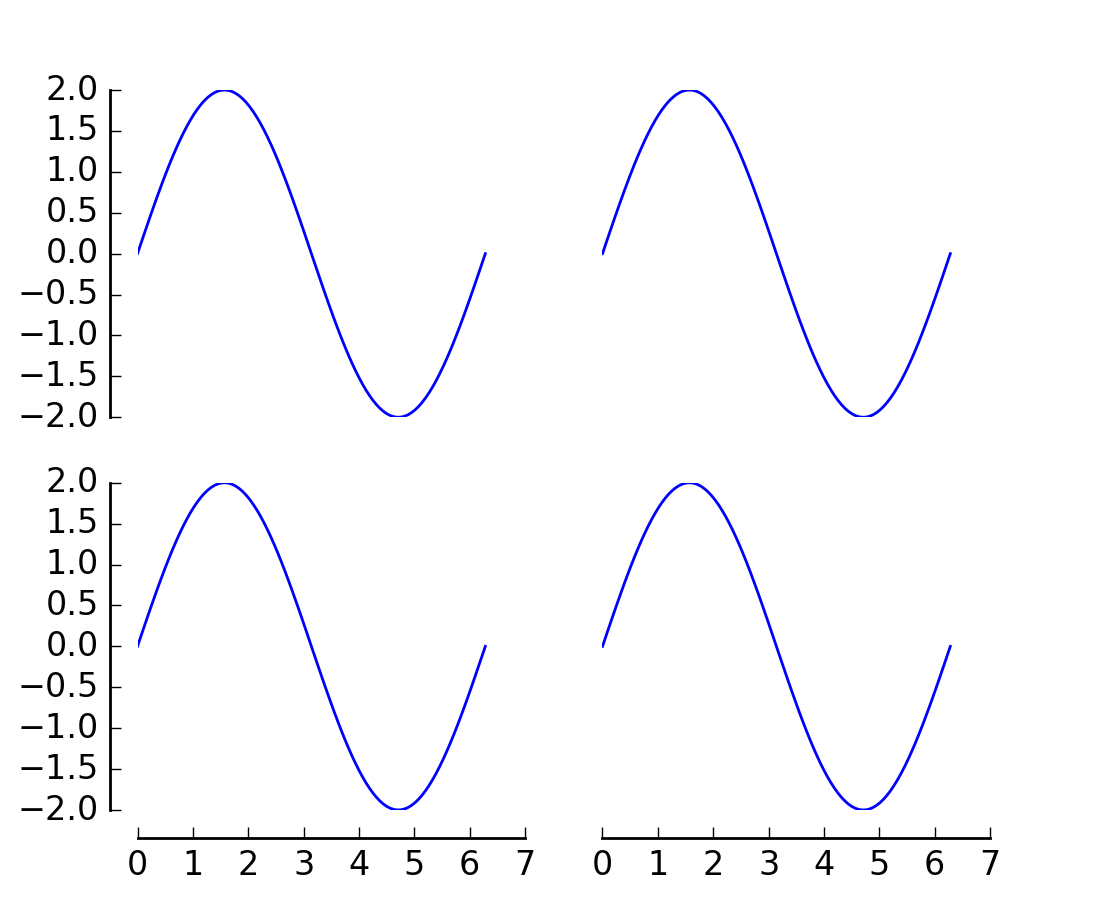
Implemented square plots feature as a new parameter in the axis
function. When argument ‘square’ is specified, equal scaling is set,
and the limits are set such that xmax-xmin == ymax-ymin.
(Source code, png, hires.png, pdf)
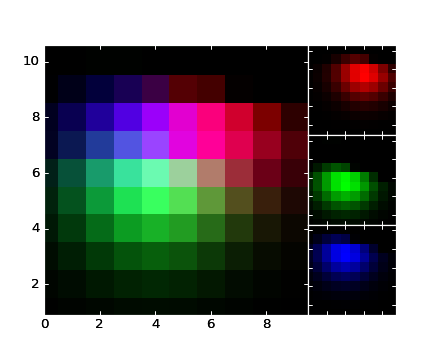
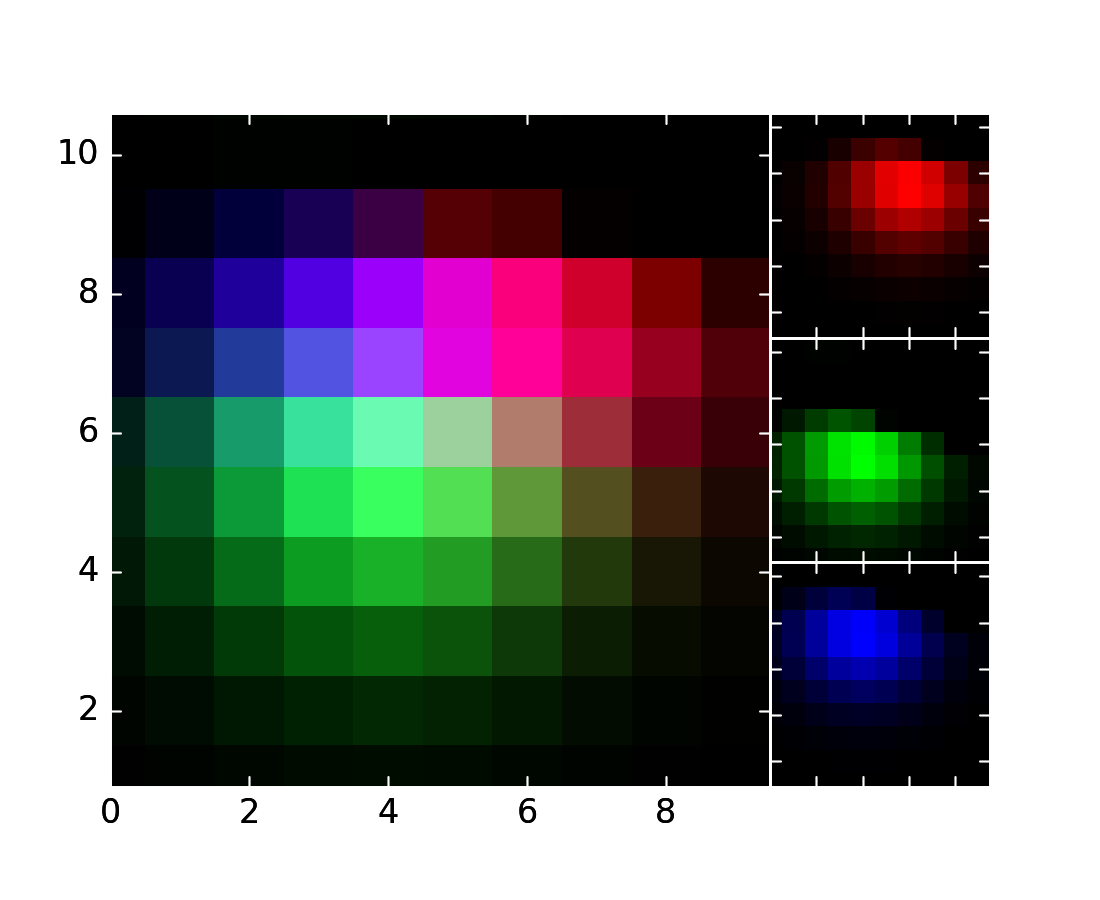
Added the ability to plot simple 2D-Array using plt.figimage(X, resize=True).
This is useful for plotting simple 2D-Array without the Axes or whitespacing
around the image.
(Source code, png, hires.png, pdf)

Added support to save the figure with the same dpi as the figure on the
screen using dpi='figure'.
Example:
f = plt.figure(dpi=25)               # dpi set to 25
S = plt.scatter([1,2,3],[4,5,6])
f.savefig('output.png', dpi='figure')    # output savefig dpi set to 25 (same as figure)
Added the ability to toggle the visibility of lines in Tables.
Functionality added to the pyplot.table() factory function under
the keyword argument “edges”. Values can be the strings “open”, “closed”,
“horizontal”, “vertical” or combinations of the letters “L”, “R”, “T”,
“B” which represent left, right, top, and bottom respectively.
Example:
table(..., edges="open")  # No line visible
table(..., edges="closed")  # All lines visible
table(..., edges="horizontal")  # Only top and bottom lines visible
table(..., edges="LT")  # Only left and top lines visible.
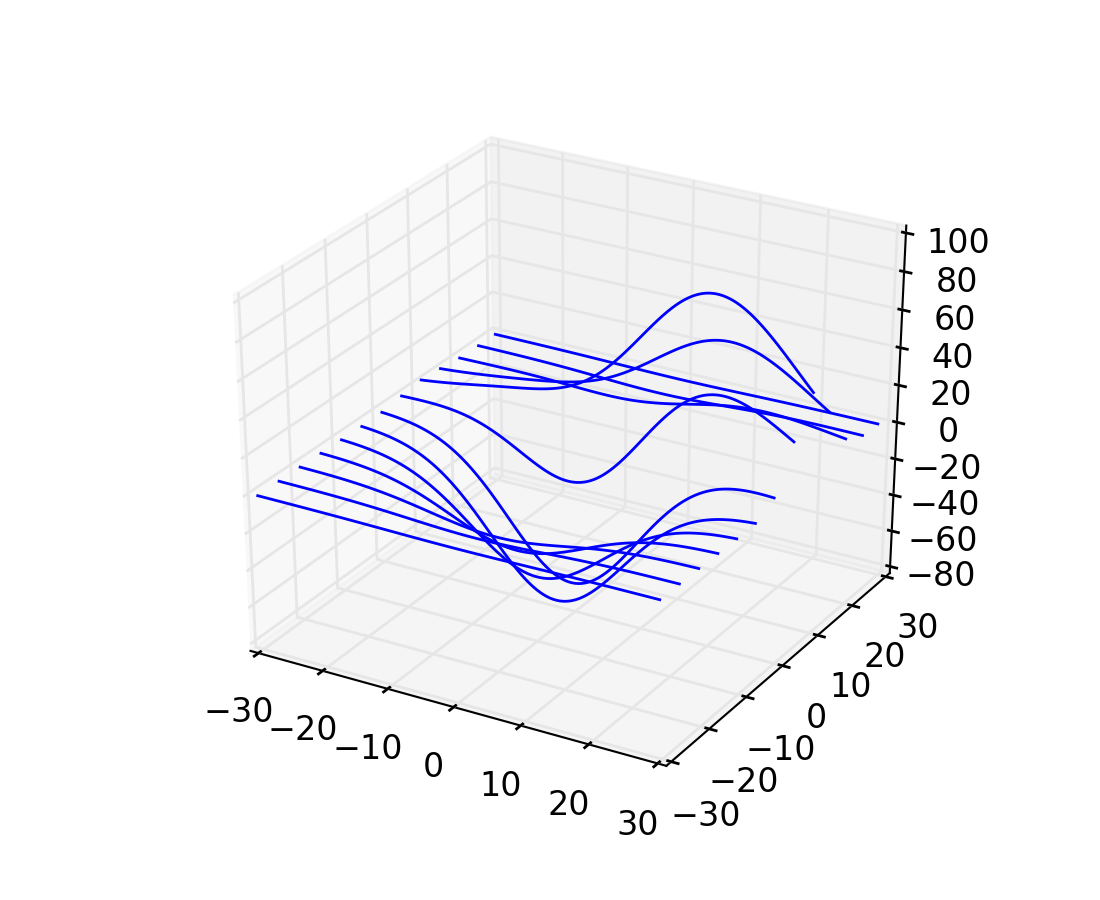
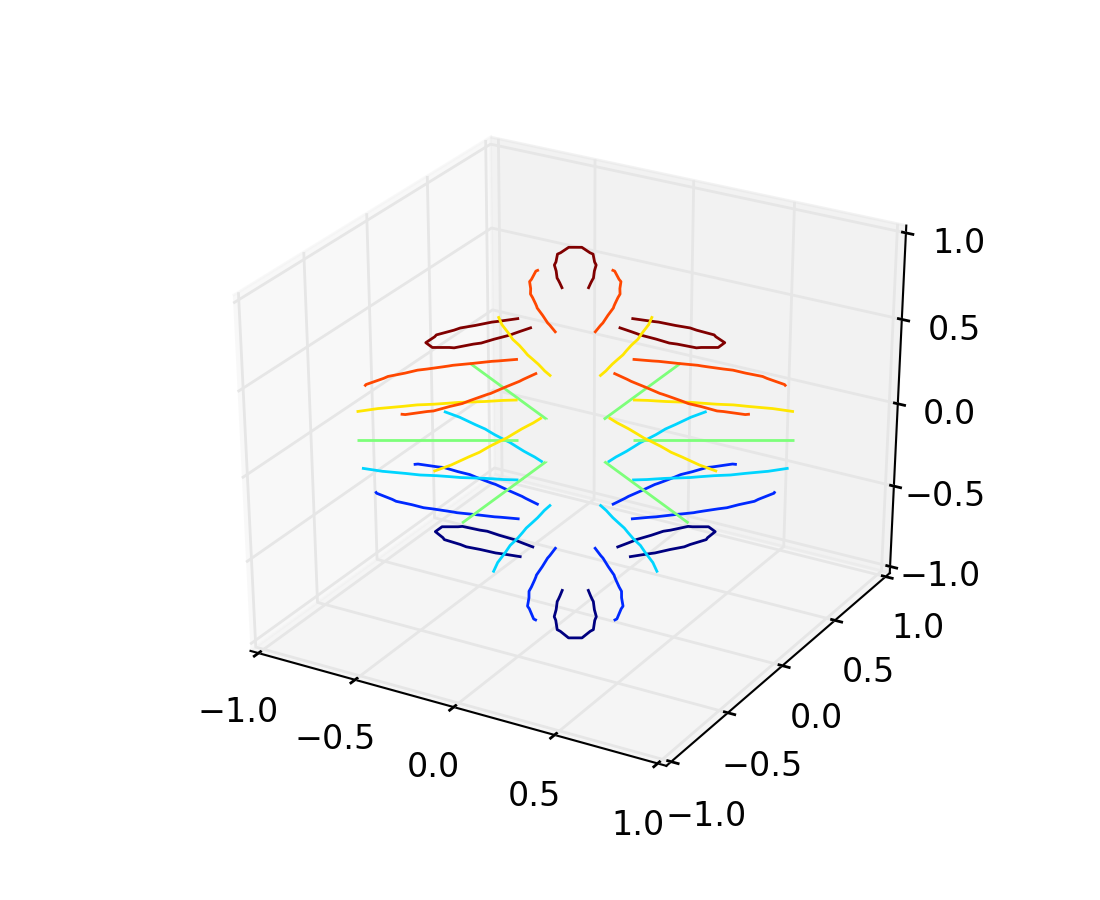
Adam Hughes added support to mplot3d’s plot_wireframe to draw only row or column line plots.
(Source code, png, hires.png, pdf)

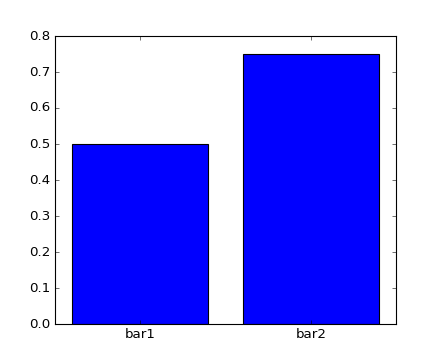
Added kwarg "tick_label" to bar and barh to support plotting bar graphs with a
text label for each bar.
(Source code, png, hires.png, pdf)

These control where the center of the pie graph are and if the Axes frame is shown.
Certain cases of 3D filled contour plots that produce polygons with multiple
holes produced improper rendering due to a loss of path information between
PolyCollection and
Poly3DCollection. A function
set_verts_and_codes() was
added to allow path information to be retained for proper rendering.
Vector file formats (pdf, ps, svg) are efficient for many types of plot element, but for some they can yield excessive file size and even rendering artifacts, depending on the renderer used for screen display. This is a problem for colorbars that show a large number of shades, as is most commonly the case. Now, if a colorbar is showing 50 or more colors, it will be rasterized in vector backends.
strftime method will format
a datetime.datetime object with the format string passed to
the formatter’s constructor. This method accepts datetimes with years
before 1900, unlike datetime.datetime.strftime().
Add {get,set}_usetex methods to Text objects
which allow artist-level control of LaTeX rendering vs the internal mathtex
rendering.
ax.remove() works as expected¶As with artists added to an Axes,
Axes objects can be removed from their figure via
remove().
set_params() function, which sets parameters
within a Locator type
instance, is now available to all Locator types. The implementation
also prevents unsafe usage by strictly defining the parameters that a
user can set.
To use, call set_params() on a Locator instance with desired arguments:
loc = matplotlib.ticker.LogLocator()
# Set given attributes for loc.
loc.set_params(numticks=8, numdecs=8, subs=[2.0], base=8)
# The below will error, as there is no such parameter for LogLocator
# named foo
# loc.set_params(foo='bar')
Date Locators (derived from DateLocator) now
implement the tick_values() method.
This is expected of all Locators derived from Locator.
The Date Locators can now be used easily without creating axes
from datetime import datetime
from matplotlib.dates import YearLocator
t0 = datetime(2002, 10, 9, 12, 10)
tf = datetime(2005, 10, 9, 12, 15)
loc = YearLocator()
values = loc.tick_values(t0, tf)
Artists draw onto objects of type OffsetBox
through DrawingArea and TextArea.
The TextArea calculates the required space for the text and so the
text is always within the bounds, for this nothing has changed.
However, DrawingArea acts as a parent for zero or more Artists that
draw on it and may do so beyond the bounds. Now child Artists can be
clipped to the bounds of the DrawingArea.
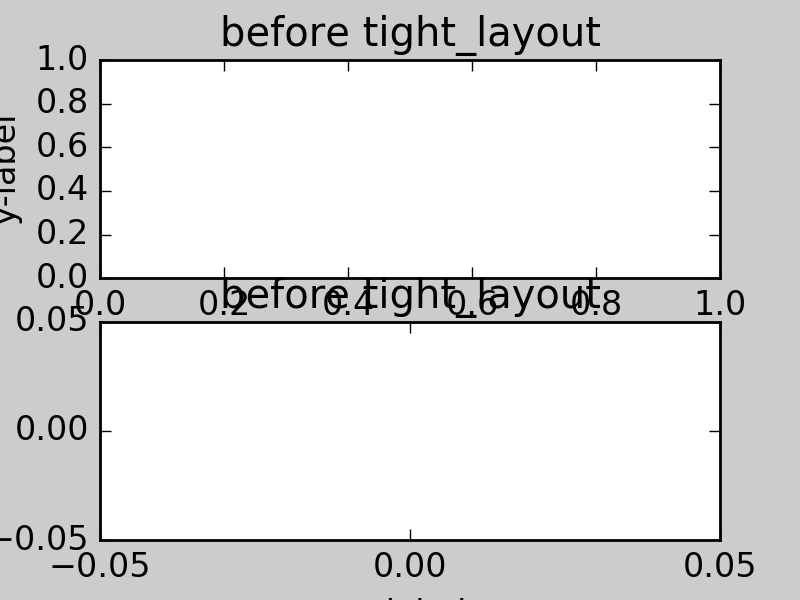
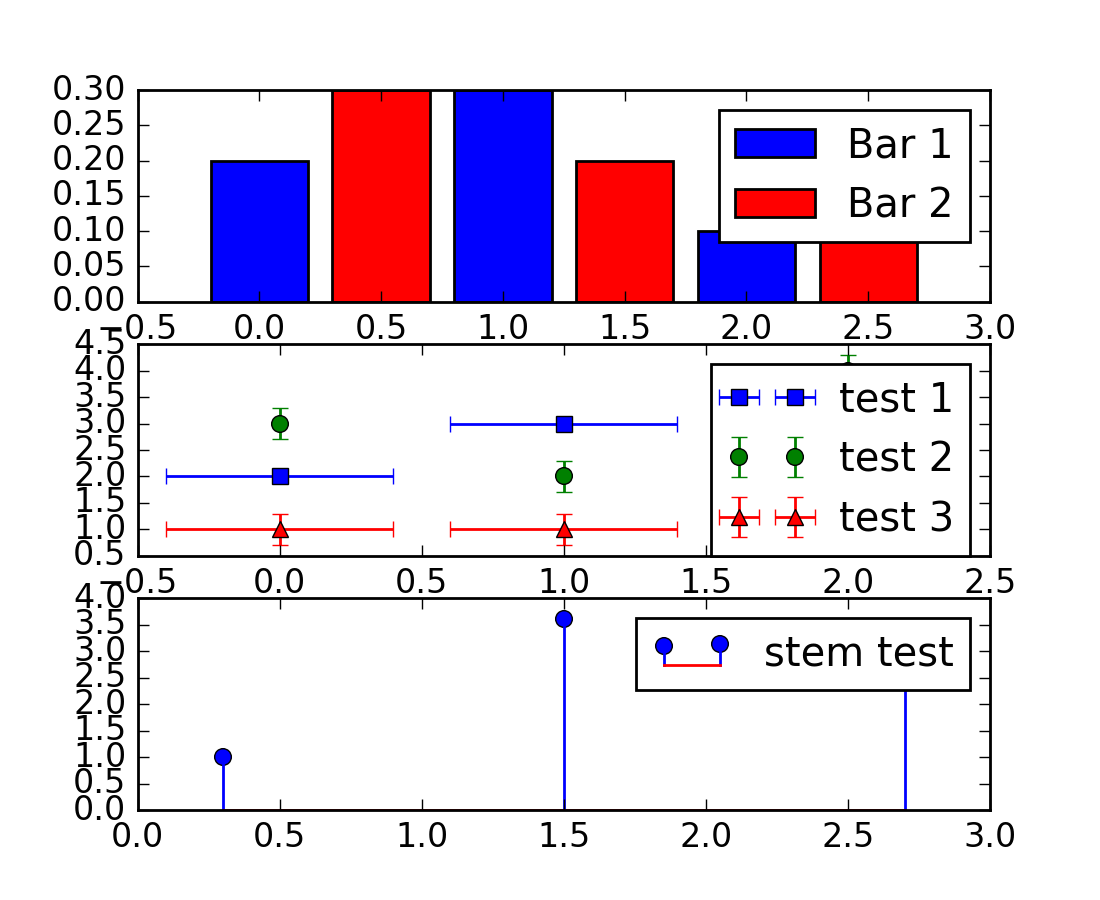
When tight_layout() or Figure.tight_layout()
or GridSpec.tight_layout() is called, OffsetBoxes that are
anchored outside the axes will not get chopped out. The OffsetBoxes will
also not get overlapped by other axes in case of multiple subplots.
Add a new method attach_note()
to the PdfPages class, allowing the
attachment of simple text notes to pages in a multi-page pdf of
figures. The new note is visible in the list of pdf annotations in a
viewer that has this facility (Adobe Reader, OSX Preview, Skim,
etc.). Per default the note itself is kept off-page to prevent it to
appear in print-outs.
PdfPages.attach_note needs to be called before savefig() in order to be
added to the correct figure.
Added the ability to check the existence of a figure using its name instead of just the figure number. Example:
figure('figure')
fignum_exists('figure') #true
Federico Ariza wrote the new ToolManager
that comes as replacement for NavigationToolbar2
ToolManager offers a new way of looking at the user interactions
with the figures. Before we had the NavigationToolbar2 with its own
tools like zoom/pan/home/save/... and also we had the shortcuts like
yscale/grid/quit/.... Toolmanager relocate all those actions as
Tools (located in backend_tools), and defines a way to
access/trigger/reconfigure them.
The Toolbars are replaced for ToolContainers that are just GUI
interfaces to trigger the tools. But don’t worry the default
backends include a ToolContainer called toolbar
Note
At the moment, we release this primarily for feedback purposes and should
be treated as experimental until further notice as API changes will occur.
For the moment the ToolManager works only with the GTK3 and Tk backends.
Make sure you use one of those.
Port for the rest of the backends is comming soon.
To activate the ToolManager include the following at the top of your file
>>> matplotlib.rcParams['toolbar'] = 'toolmanager'
The most important feature is the ability to easily reconfigure the ToolContainer (aka toolbar). For example, if we want to remove the “forward” button we would just do.
>>> fig.canvas.manager.toolmanager.remove_tool('forward')
Now if you want to programmatically trigger the “home” button
>>> fig.canvas.manager.toolmanager.trigger_tool('home')
It is possible to add new tools to the ToolManager
A very simple tool that prints “You’re awesome” would be:
from matplotlib.backend_tools import ToolBase
class AwesomeTool(ToolBase):
    def trigger(self, *args, **kwargs):
        print("You're awesome")
To add this tool to ToolManager
>>> fig.canvas.manager.toolmanager.add_tool('Awesome', AwesomeTool)
If we want to add a shortcut (“d”) for the tool
>>> fig.canvas.manager.toolmanager.update_keymap('Awesome', 'd')
To add it to the toolbar inside the group ‘foo’
>>> fig.canvas.manager.toolbar.add_tool('Awesome', 'foo')
There is a second class of tools, “Toggleable Tools”, this are almost
the same as our basic tools, just that belong to a group, and are
mutually exclusive inside that group. For tools derived from
ToolToggleBase there are two basic methods enable and disable
that are called automatically whenever it is toggled.
A full example is located in user_interfaces example code: toolmanager.py
This is primarily how pandas stores a sequence of strings
import pandas as pd
import matplotlib.cbook as cbook

a = np.array(['a', 'b', 'c'])
print(cbook.is_sequence_of_strings(a))  # True

a = np.array(['a', 'b', 'c'], dtype=object)
print(cbook.is_sequence_of_strings(a))  # True

s = pd.Series(['a', 'b', 'c'])
print(cbook.is_sequence_of_strings(s))  # True
Previously, the last two prints returned false.
close-figs argument for plot directive¶Matplotlib has a sphinx extension plot_directive that creates plots for
inclusion in sphinx documents. Matplotlib 1.5 adds a new option to the plot
directive - close-figs - that closes any previous figure windows before
creating the plots. This can help avoid some surprising duplicates of plots
when using plot_directive.
imread¶The imread() function now accepts URL strings that
point to remote PNG files. This circumvents the generation of a
HTTPResponse object directly.
Animation instances gained a _repr_html_ method
to support inline display of animations in the notebook. The method used
to display is controlled by the animation.html rc parameter, which
currently supports values of none and html5. none is the
default, performing no display. html5 converts the animation to an
h264 encoded video, which is embedded directly in the notebook.
Users not wishing to use the _repr_html_ display hook can also manually
call the to_html5_video method to get the HTML and display using
IPython’s HTML display class:
from IPython.display import HTML
HTML(anim.to_html5_video())
Handling of pkg-config has been fixed in so far as it is now
possible to set it using the environment variable PKG_CONFIG. This
is important if your toolchain is prefixed. This is done in a simpilar
way as setting CC or CXX before building. An example follows.
export PKG_CONFIG=x86_64-pc-linux-gnu-pkg-config
Thomas A. Caswell served as the release manager for the 1.4 release.
In heatmaps, a green-to-red spectrum is often used to indicate intensity of
activity, but this can be problematic for the red/green colorblind. A new,
colorblind-friendly colormap is now available at matplotlib.cm.Wistia.
This colormap maintains the red/green symbolism while achieving deuteranopic
legibility through brightness variations. See
here
for more information.
Phil Elson added a new backend, named “nbagg”, which enables interactive figures in a live IPython notebook session. The backend makes use of the infrastructure developed for the webagg backend, which itself gives standalone server backed interactive figures in the browser, however nbagg does not require a dedicated matplotlib server as all communications are handled through the IPython Comm machinery.
As with other backends nbagg can be enabled inside the IPython notebook with:
import matplotlib
matplotlib.use('nbagg')
Once figures are created and then subsequently shown, they will placed in an interactive widget inside the notebook allowing panning and zooming in the same way as any other matplotlib backend. Because figures require a connection to the IPython notebook server for their interactivity, once the notebook is saved, each figure will be rendered as a static image - thus allowing non-interactive viewing of figures on services such as nbviewer.
Ben Gamari added a power-law normalization method,
PowerNorm. This class maps a range of
values to the interval [0,1] with power-law scaling with the exponent
provided by the constructor’s gamma argument. Power law normalization
can be useful for, e.g., emphasizing small populations in a histogram.
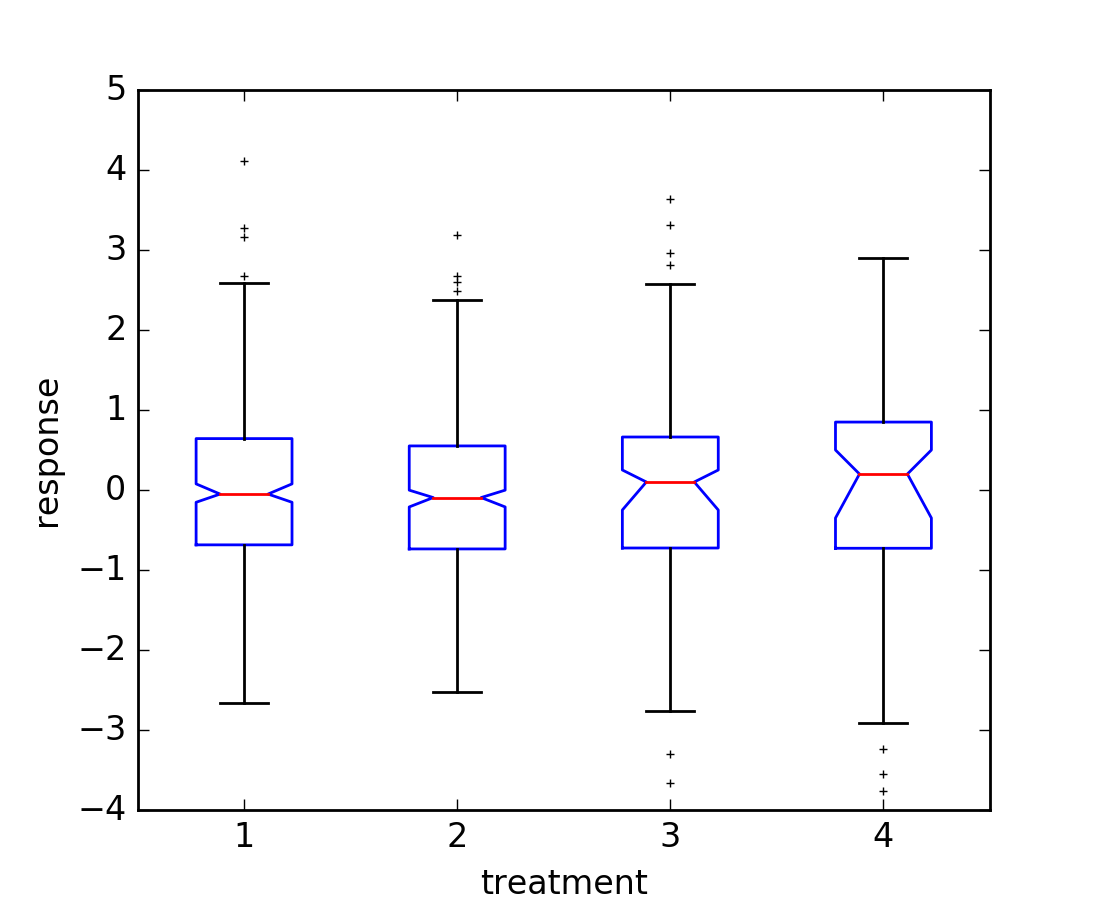
Paul Hobson overhauled the boxplot() method such
that it is now completely customizable in terms of the styles and positions
of the individual artists. Under the hood, boxplot()
relies on a new function (boxplot_stats()), which
accepts any data structure currently compatible with
boxplot(), and returns a list of dictionaries
containing the positions for each element of the boxplots. Then
a second method, bxp() is called to draw the boxplots
based on the stats.
The boxplot() function can be used as before to
generate boxplots from data in one step. But now the user has the
flexibility to generate the statistics independently, or to modify the
output of boxplot_stats() prior to plotting
with bxp().
Lastly, each artist (e.g., the box, outliers, cap, notches) can now be toggled on or off and their styles can be passed in through individual kwargs. See the examples: statistics example code: boxplot_demo.py and statistics example code: bxp_demo.py
Added a bool kwarg, manage_xticks, which if False disables the management
of the ticks and limits on the x-axis by bxp().
Andrew Dawson added support for datetime axes to
contour(), contourf(),
pcolormesh() and pcolor().
Todd Jennings added support for new types of frequency spectrum plots:
magnitude_spectrum(),
phase_spectrum(), and
angle_spectrum(), as well as corresponding functions
in mlab.
He also added these spectrum types to specgram(),
as well as adding support for linear scaling there (in addition to the
existing dB scaling). Support for additional spectrum types was also added to
specgram().
He also increased the performance for all of these functions and plot types.
Todd Jennings added support for 2D arrays in the
detrend_mean(), detrend_none(),
and detrend(), as well as adding
apply_window() which support windowing 2D arrays.
Todd Jennings added some functions to mlab to make it easier to use numpy
strides to create memory-efficient 2D arrays. This includes
stride_repeat(), which repeats an array to create a 2D
array, and stride_windows(), which uses a moving window
to create a 2D array from a 1D array.
Added FormatStrFormatterNewStyle which does the same job as
FormatStrFormatter, but accepts new-style formatting strings
instead of printf-style formatting strings
streamplot() uses a base grid size of 30x30 for both
density=1 and density=(1, 1). Previously a grid size of 30x30 was used for
density=1, but a grid size of 25x25 was used for density=(1, 1).
Added the kwarg ‘which’ to get_xticklabels(),
get_yticklabels() and
get_ticklabels(). ‘which’ can be ‘major’, ‘minor’, or
‘both’ select which ticks to return, like
set_ticks_position(). If ‘which’ is None then the old
behaviour (controlled by the bool minor).
The kwarg ‘axes_pad’ to mpl_toolkits.axes_grid1.ImageGrid can now
be a tuple if separate horizontal/vertical padding is needed.
This is supposed to be very helpful when you have a labelled legend next to
every subplot and you need to make some space for legend’s labels.
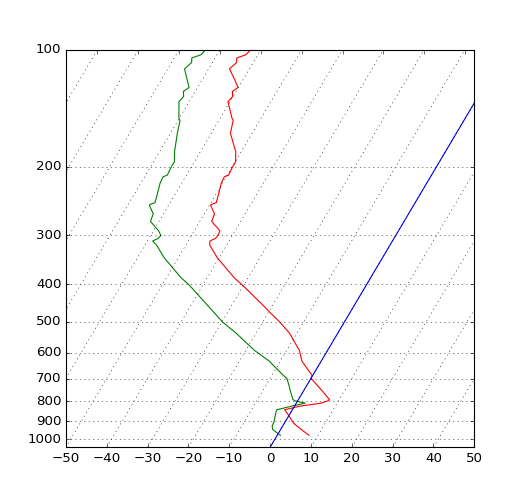
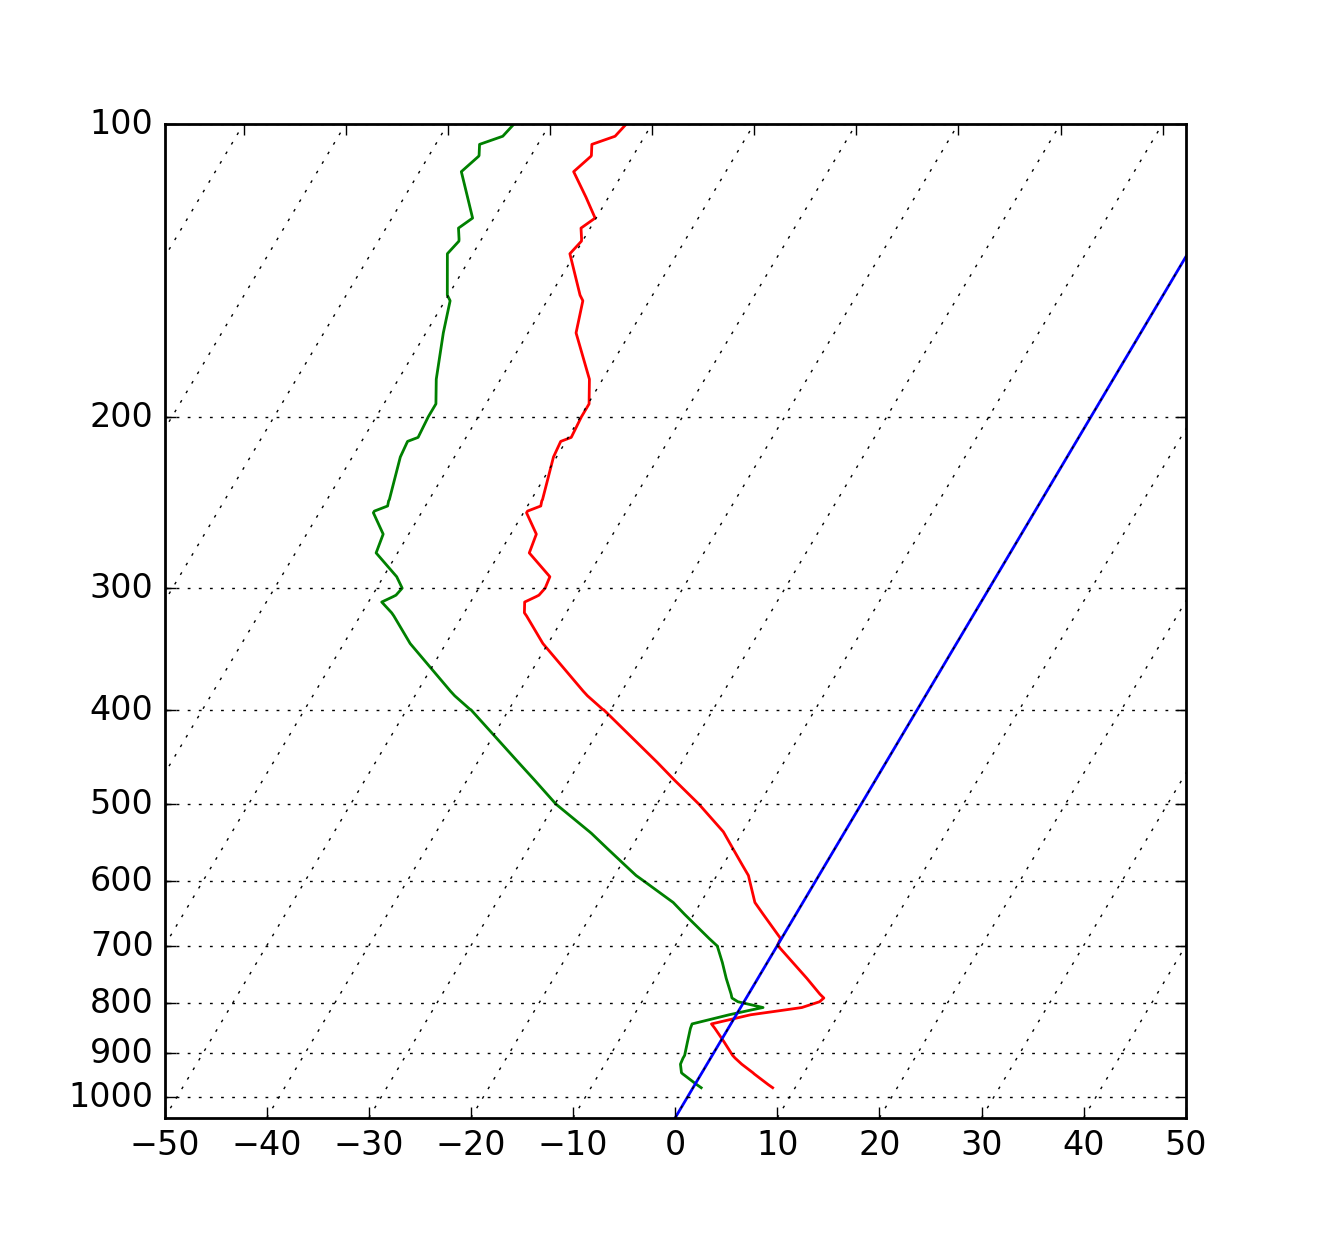
The Affine2D gained additional methods
skew and skew_deg to create skewed transformations. Additionally,
matplotlib internals were cleaned up to support using such transforms in
Axes. This transform is important for some plot types,
specifically the Skew-T used in meteorology.
(Source code, png, hires.png, pdf)
Added the kwargs ‘wedgeprops’ and ‘textprops’ to pie()
to accept properties for wedge and text objects in a pie. For example, one can
specify wedgeprops = {‘linewidth’:3} to specify the width of the borders of
the wedges in the pie. For more properties that the user can specify, look at
the docs for the wedge and text objects.
Larry Bradley fixed the errorbar() method such
that the upper and lower limits (lolims, uplims, xlolims,
xuplims) now point in the correct direction.
Added the Axes method add_image to put image
handling on a par with artists, collections, containers, lines, patches,
and tables.
Per Parker, Gregory Kelsie, Adam Ortiz, Kevin Chan, Geoffrey Lee, Deokjae Donald Seo, and Taesu Terry Lim added a basic implementation for violin plots. Violin plots can be used to represent the distribution of sample data. They are similar to box plots, but use a kernel density estimation function to present a smooth approximation of the data sample used. The added features are:
violin() - Renders a violin plot from a collection of
statistics.
violin_stats() - Produces a collection of statistics
suitable for rendering a violin plot.
violinplot() - Creates a violin plot from a set of
sample data. This method makes use of violin_stats()
to process the input data, and violin_stats() to
do the actual rendering. Users are also free to modify or replace the output of
violin_stats() in order to customize the violin plots
to their liking.
This feature was implemented for a software engineering course at the University of Toronto, Scarborough, run in Winter 2014 by Anya Tafliovich.
markevery options to show only a subset of markers¶Rohan Walker extended the markevery property in
Line2D. You can now specify a subset of markers to
show with an int, slice object, numpy fancy indexing, or float. Using a float
shows markers at approximately equal display-coordinate-distances along the
line.
Added code to
transform_non_affine()
to ensure that the calculated theta value was between the range of 0 and 2 * pi
since the problem was that the value can become negative after applying the
direction and rotation to the theta calculation.
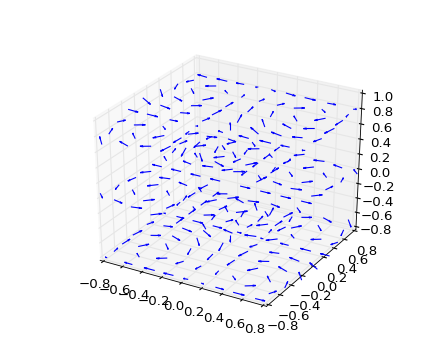
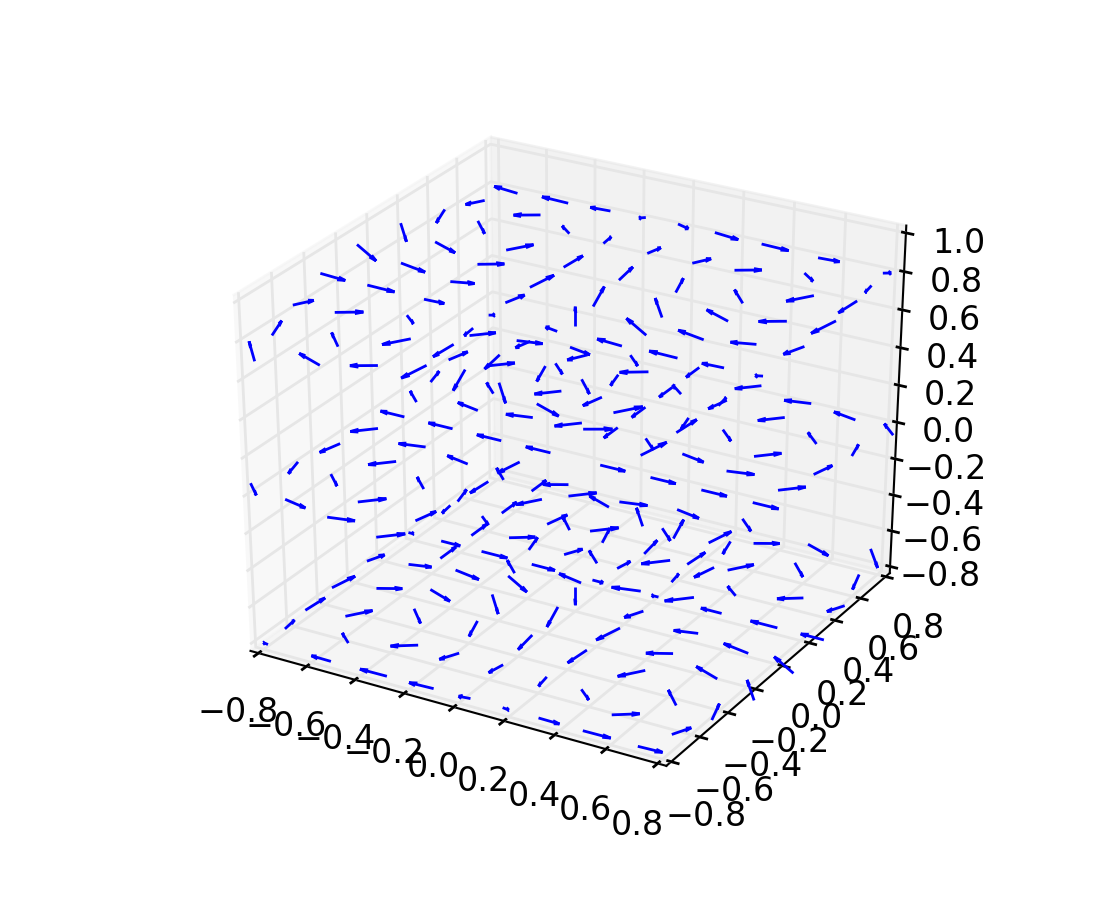
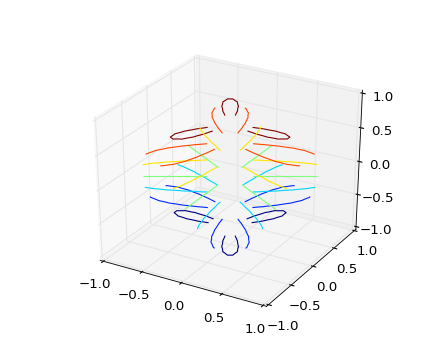
A team of students in an Engineering Large Software Systems course, taught
by Prof. Anya Tafliovich at the University of Toronto, implemented a simple
version of a quiver plot in 3D space for the mplot3d toolkit as one of their
term project. This feature is documented in quiver().
The team members are: Ryan Steve D’Souza, Victor B, xbtsw, Yang Wang, David,
Caradec Bisesar and Vlad Vassilovski.
(Source code, png, hires.png, pdf)
Added the ability to control the angular position of the r-tick labels
on a polar plot via set_rlabel_position().
Andrew Dawson added support for n-d array handling to
matplotlib.dates.num2date(), matplotlib.dates.date2num()
and matplotlib.dates.datestr2num(). Support is also added to the unit
conversion interfaces matplotlib.dates.DateConverter and
matplotlib.units.Registry.
savefig.transparent added¶Controls whether figures are saved with a transparent
background by default. Previously savefig always defaulted
to a non-transparent background.
axes.titleweight¶Added rcParam to control the weight of the title
axes.formatter.useoffset added¶Controls the default value of useOffset in ScalarFormatter. If
True and the data range is much smaller than the data average, then
an offset will be determined such that the tick labels are
meaningful. If False then the full number will be formatted in all
conditions.
nbagg.transparent added¶Controls whether nbagg figures have a transparent
background. nbagg.transparent is True by default.
Matplotlib now looks for configuration files (both rcparams and style) in XDG compliant locations.
style package added¶You can now easily switch between different styles using the new style
package:
>>> from matplotlib import style
>>> style.use('dark_background')
Subsequent plots will use updated colors, sizes, etc. To list all available styles, use:
>>> print style.available
You can add your own custom <style name>.mplstyle files to
~/.matplotlib/stylelib or call use with a URL pointing to a file with
matplotlibrc settings.
Note that this is an experimental feature, and the interface may change as users test out this new feature.
Martin Fitzpatrick and Tom Badran implemented a Qt5 backend. The differences in namespace locations between Qt4 and Qt5 was dealt with by shimming Qt4 to look like Qt5, thus the Qt5 implementation is the primary implementation. Backwards compatibility for Qt4 is maintained by wrapping the Qt5 implementation.
The Qt5Agg backend currently does not work with IPython’s %matplotlib magic.
The 1.4.0 release has a known bug where the toolbar is broken. This can be fixed by:
cd path/to/installed/matplotlib
wget https://github.com/matplotlib/matplotlib/pull/3322.diff
# unix2dos 3322.diff (if on windows to fix line endings)
patch -p2 < 3322.diff
Rudolf Höfler changed the appearance of the subplottool. All sliders are vertically arranged now, buttons for tight layout and reset were added. Furthermore, the subplottool is now implemented as a modal dialog. It was previously a QMainWindow, leaving the SPT open if one closed the plot window.
In the figure options dialog one can now choose to (re-)generate a simple automatic legend. Any explicitly set legend entries will be lost, but changes to the curves’ label, linestyle, et cetera will now be updated in the legend.
Interactive performance of the Qt4 backend has been dramatically improved under windows.
The mapping of key-signals from Qt to values matplotlib understands was greatly improved (For both Qt4 and Qt5).
The Cairo backends are now able to use the cairocffi bindings which are more actively maintained than the pycairo bindings.
The Gtk3Agg backend now works on Python 3.x, if the cairocffi bindings are installed.
Added context manager for saving to multi-page PDFs.
The svg backend will now render Text objects’
url as a link in output SVGs. This allows one to make clickable text in
saved figures using the url kwarg of the Text
class.
Added the fontproperties kwarg to
AnchoredSizeBar to
control the font properties.
The :context: directive in the plot_directive
Sphinx extension can now accept an optional reset setting, which will
cause the context to be reset. This allows more than one distinct context to
be present in documentation. To enable this option, use :context: reset
instead of :context: any time you want to reset the context.
The Legend guide and Path effects guide have both been updated to better reflect the full potential of each of these powerful features.
Added an option span_stays to the
SpanSelector which makes the selector
rectangle stay on the axes after you release the mouse.
Matplotlib will now run on google app engine.
1.3.1 is a bugfix release, primarily dealing with improved setup and handling of dependencies, and correcting and enhancing the documentation.
The following changes were made in 1.3.1 since 1.3.0.
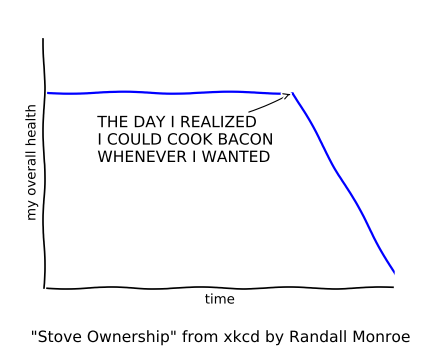
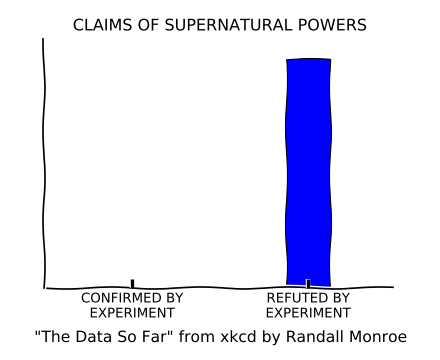
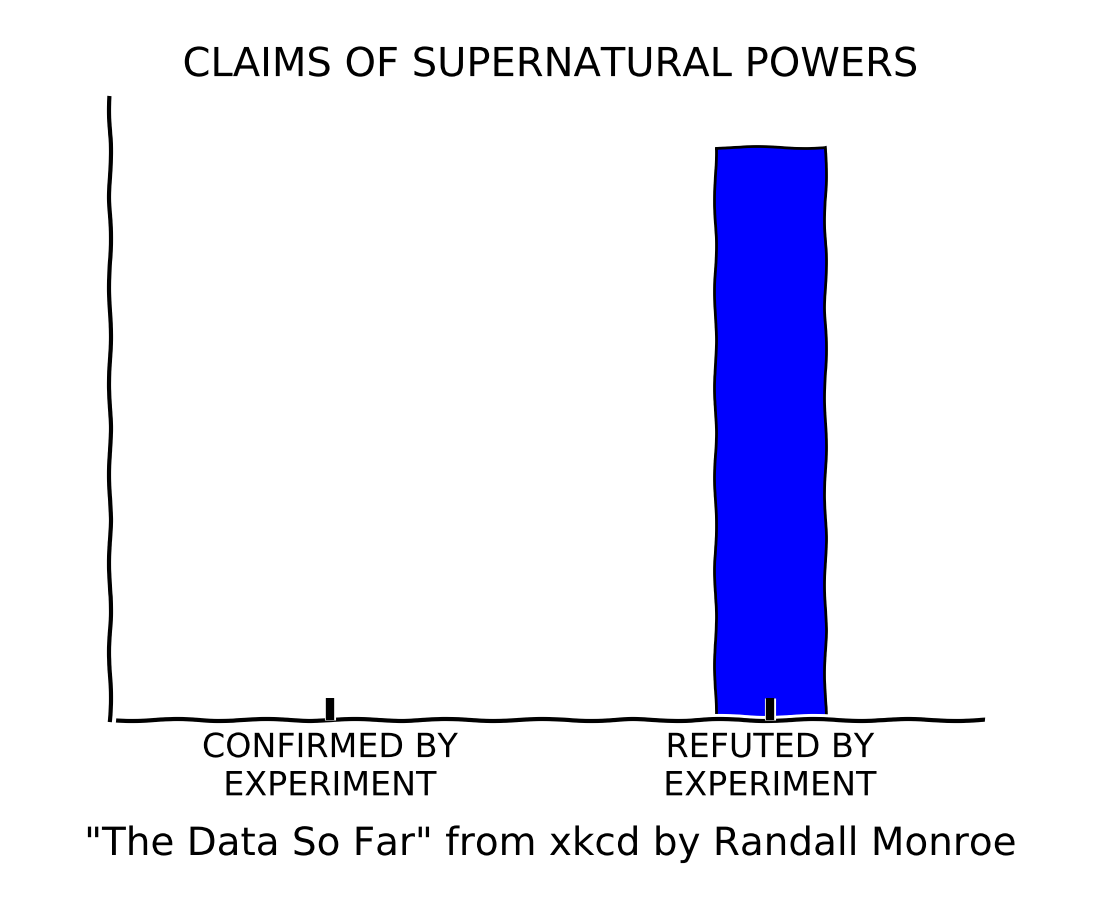
matplotlib.backends.backend_pdf.PdfPages).xkcd-style sketch plotting¶To give your plots a sense of authority that they may be missing,
Michael Droettboom (inspired by the work of many others in
PR #1329) has added an xkcd-style sketch
plotting mode. To use it, simply call matplotlib.pyplot.xkcd()
before creating your plot. For really fine control, it is also possible
to modify each artist’s sketch parameters individually with
matplotlib.artist.Artist.set_sketch_params().
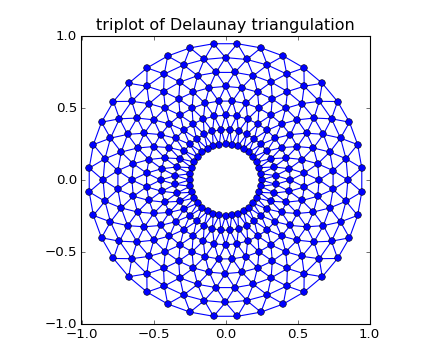
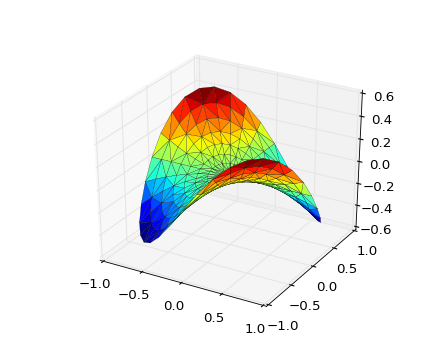
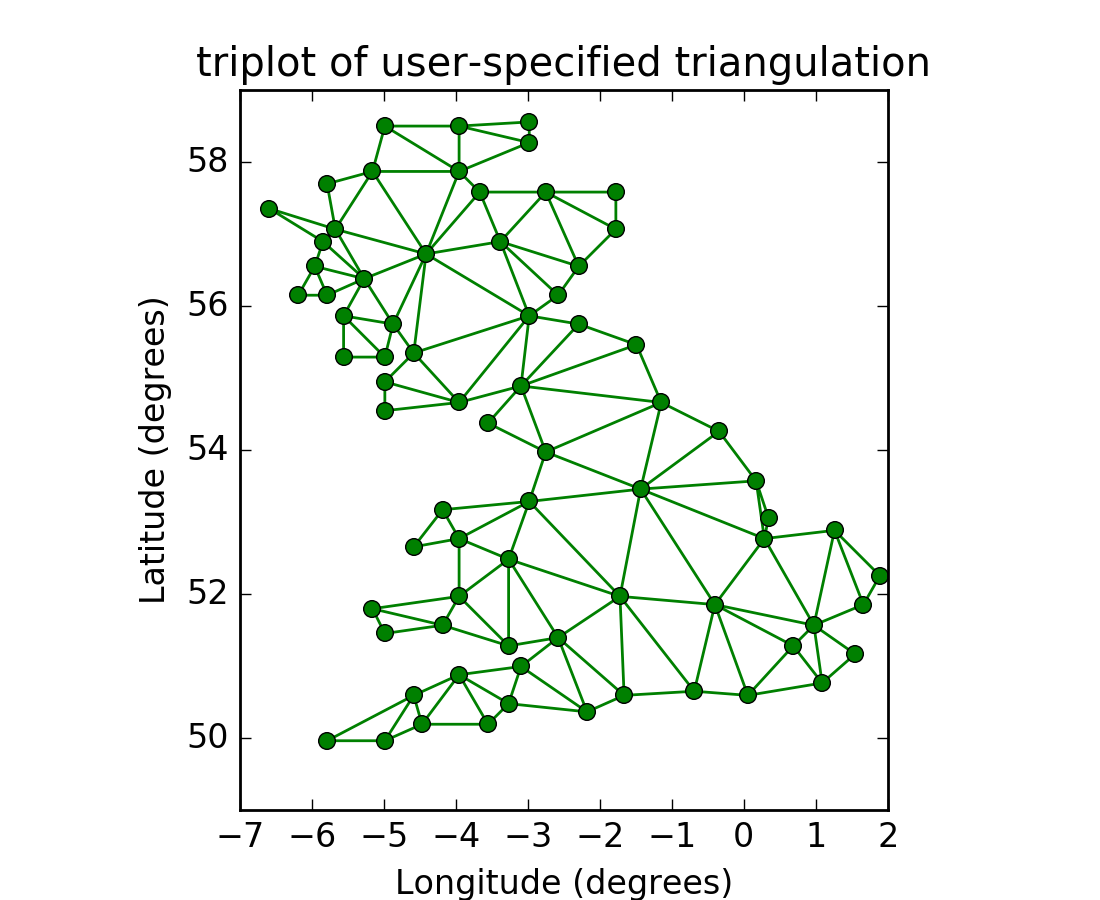
Damon McDougall updated the
tricontour() and
tricontourf() methods to allow 3D
contour plots on abitrary unstructured user-specified triangulations.
(Source code, png, hires.png, pdf)

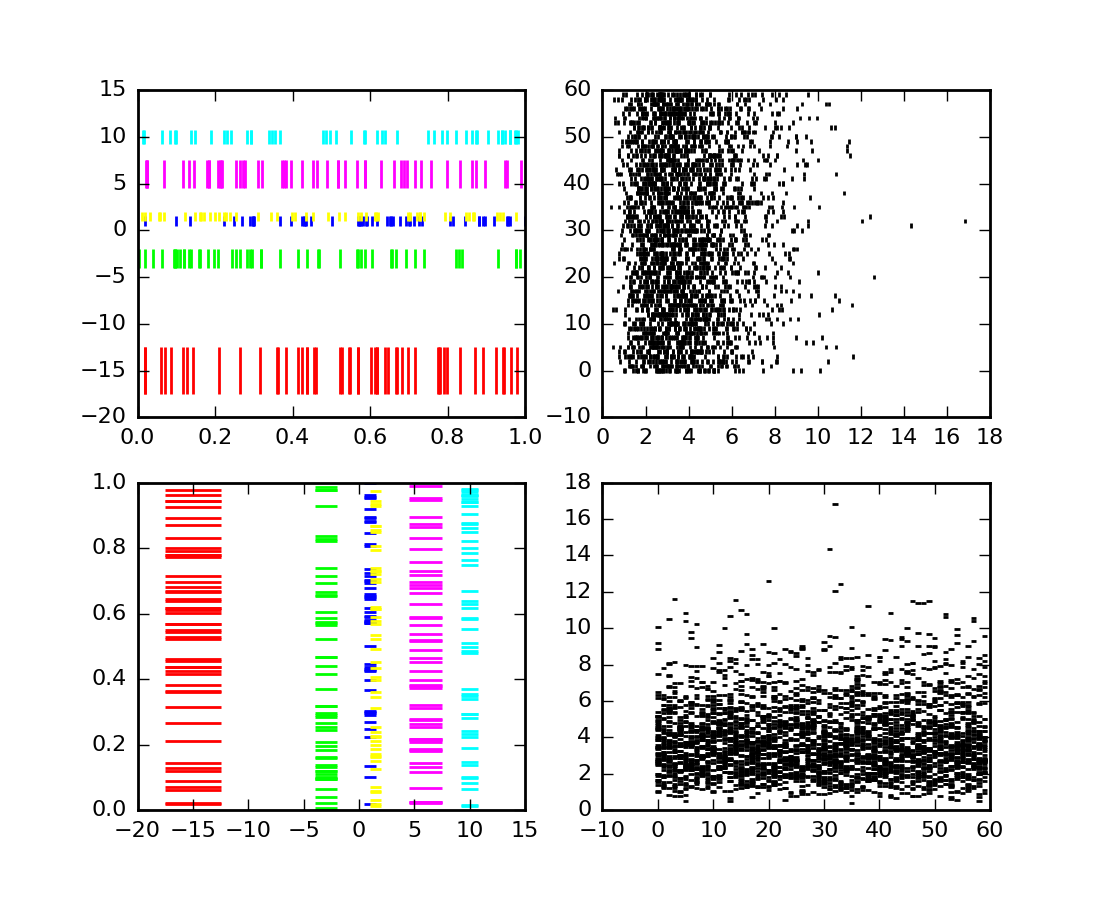
Todd Jennings added a eventplot() function to
create multiple rows or columns of identical line segments
(Source code, png, hires.png, pdf)

As part of this feature, there is a new
EventCollection class that allows for
plotting and manipulating rows or columns of identical line segments.
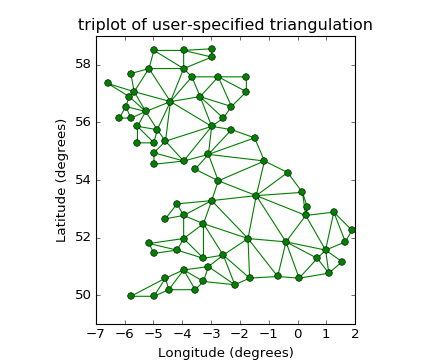
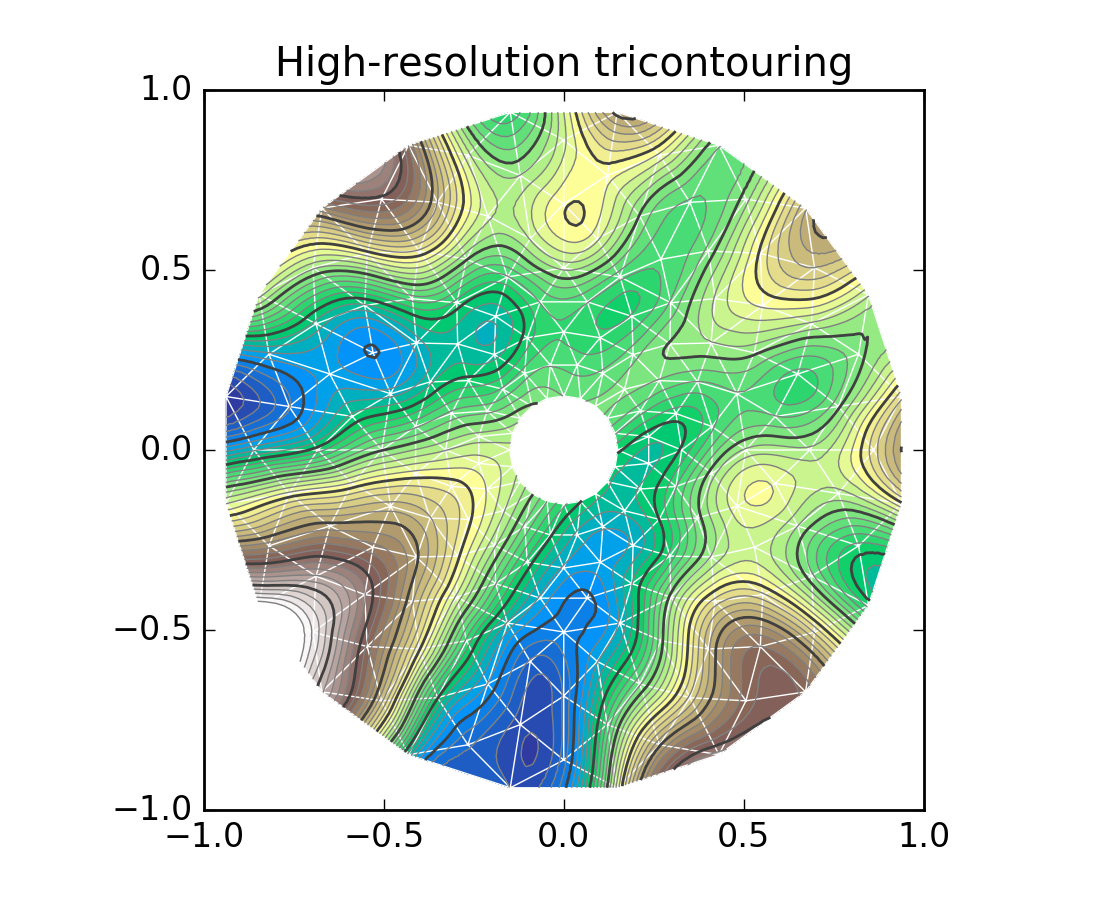
Geoffroy Billotey and Ian Thomas added classes to perform
interpolation within triangular grids:
(LinearTriInterpolator and
CubicTriInterpolator) and a utility class to
find the triangles in which points lie
(TrapezoidMapTriFinder). A helper class to
perform mesh refinement and smooth contouring was also added
(UniformTriRefiner). Finally, a class
implementing some basic tools for triangular mesh improvement was
added (TriAnalyzer).
(Source code, png, hires.png, pdf)

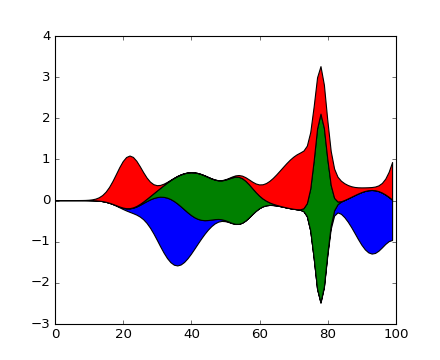
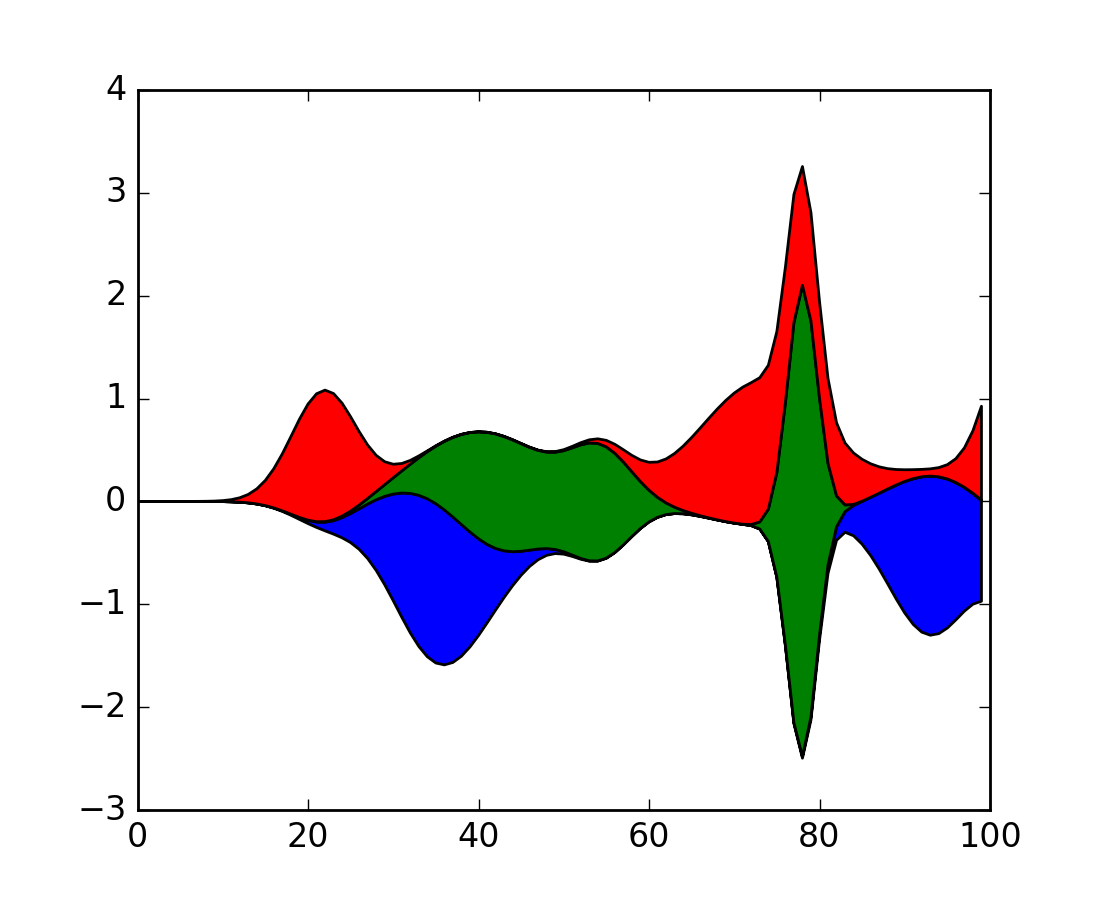
Till Stensitzki added non-zero baselines to
stackplot(). They may be symmetric or
weighted.
(Source code, png, hires.png, pdf)
Andrew Dawson added a new keyword argument extendrect to
colorbar() to optionally make colorbar
extensions rectangular instead of triangular.
Paul Hobson provided a fix to the boxplot()
method that prevent whiskers from being drawn inside the box for
oddly distributed data sets.
A call to subplot() without any arguments now
acts the same as subplot(111) or subplot(1,1,1) – it creates one
axes for the whole figure. This was already the behavior for both
axes() and
subplots(), and now this consistency is
shared with subplot().
Wes Campaigne modified how Patch objects are
drawn such that (for backends supporting transparency) you can set different
alpha values for faces and edges, by specifying their colors in RGBA format.
Note that if you set the alpha attribute for the patch object (e.g. using
set_alpha() or the alpha keyword
argument), that value will override the alpha components set in both the
face and edge colors.
Thanks to Jae-Joon Lee, path effects now also work on plot lines.
(Source code, png, hires.png, pdf)
Phil Elson added the matplotlib.colors.from_levels_and_colors()
function to easily create a colormap and normalizer for representation
of discrete colors for plot types such as
matplotlib.pyplot.pcolormesh(), with a similar interface to that
of contourf().
Wes Campaigne and Phil Elson fixed the Agg backend such that PNGs are
now saved with the correct background color when
fig.patch.get_alpha() is not 1.
bbox_inches="tight" functionality¶Passing bbox_inches="tight" through to plt.save() now takes
into account all artists on a figure - this was previously not the
case and led to several corner cases which did not function as
expected.
The svg and pgf backends are now able to save text alignment
information to their output formats. This allows to edit text elements
in saved figures, using Inkscape for example, while preserving their
intended position. For svg please note that you’ll have to disable
the default text-to-path conversion (mpl.rc('svg',
fonttype='none')).
The vertical alignment of text is now consistent across backends. You may see small differences in text placement, particularly with rotated text.
If you are using a custom backend, note that the draw_text renderer
method is now passed the location of the baseline, not the location of
the bottom of the text bounding box.
Multi-line text will now leave enough room for the height of very tall or very low text, such as superscripts and subscripts.
Andrew Dawson added the ability to add axes titles flush with the left
and right sides of the top of the axes using a new keyword argument
loc to title().
Brian Mattern modified the manual contour plot label positioning code to interpolate along line segments and find the actual closest point on a contour to the requested position. Previously, the closest path vertex was used, which, in the case of straight contours was sometimes quite distant from the requested location. Much more precise label positioning is now possible.
Phil Elson made it easier to search for rcParameters by passing a
valid regular expression to matplotlib.RcParams.find_all().
matplotlib.RcParams now also has a pretty repr and str
representation so that search results are printed prettily:
>>> import matplotlib
>>> print(matplotlib.rcParams.find_all('\.size'))
RcParams({'font.size': 12,
          'xtick.major.size': 4,
          'xtick.minor.size': 2,
          'ytick.major.size': 4,
          'ytick.minor.size': 2})
axes.xmargin and axes.ymargin added to rcParams¶rcParam values (axes.xmargin and axes.ymargin) were added
to configure the default margins used. Previously they were
hard-coded to default to 0, default value of both rcParam values is 0.
The font.* rcParams now affect only text objects created after the
rcParam has been set, and will not retroactively affect already
existing text objects. This brings their behavior in line with most
other rcParams.
savefig.jpeg_quality added to rcParams¶rcParam value savefig.jpeg_quality was added so that the user can
configure the default quality used when a figure is written as a JPEG.
The default quality is 95; previously, the default quality was 75.
This change minimizes the artifacting inherent in JPEG images,
particularly with images that have sharp changes in color as plots
often do.
Michael Droettboom, Phil Elson and others have developed a new backend, WebAgg, to display figures in a web browser. It works with animations as well as being fully interactive.
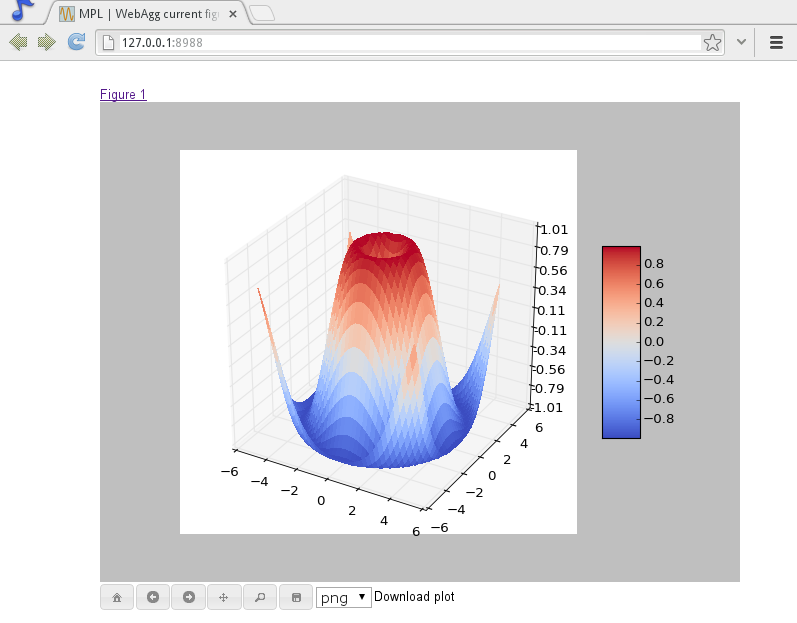
Future versions of matplotlib will integrate this backend with the IPython notebook for a fully web browser based plotting frontend.
Martin Spacek made the save figure dialog remember the last directory
saved to. The default is configurable with the new savefig.directory
rcParam in matplotlibrc.
Nelle Varoquaux has started an ongoing project to convert matplotlib’s docstrings to numpydoc format. See MEP10 for more information.
Tony Yu has begun work reorganizing the examples into more meaningful categories. The new gallery page is the fruit of this ongoing work. See MEP12 for more information.
For the sake of brevity and clarity, most of the examples now use the newer
subplots(), which creates a figure and one
(or multiple) axes object(s) in one call. The old way involved a call
to figure(), followed by one (or multiple)
subplot() calls.
A number of features that were deprecated in 1.2 or earlier, or have not been in a working state for a long time have been removed. Highlights include removing the Qt version 3 backends, and the FltkAgg and Emf backends. See Changes in 1.3.x for a complete list.
matplotlib 1.3 includes an entirely rewritten setup script. We now
ship fewer dependencies with the tarballs and installers themselves.
Notably, pytz, dateutil, pyparsing and six are no longer
included with matplotlib. You can either install them manually first,
or let pip install them as dependencies along with matplotlib. It
is now possible to not include certain subcomponents, such as the unit
test data, in the install. See setup.cfg.template for more
information.
On Linux, matplotlib now uses the XDG base directory specification
to find the matplotlibrc configuration file. matplotlibrc should
now be kept in config/matplotlib, rather than matplotlib.
If your configuration is found in the old location, it will still be
used, but a warning will be displayed.
Figures created through pyplot.figure are retained until they are
explicitly closed. It is therefore common for new users of matplotlib
to run out of memory when creating a large series of figures in a loop
without closing them.
matplotlib will now display a RuntimeWarning when too many figures
have been opened at once. By default, this is displayed for 20 or
more figures, but the exact number may be controlled using the
figure.max_open_warning rcParam.
The individual items of a collection may now have different alpha values and be rendered correctly. This also fixes a bug where collections were always filled in the PDF backend.
When putting multiple images onto the same axes, the background color of the axes will now show through correctly.
Matplotlib 1.2 is the first version to support Python 3.x, specifically Python 3.1 and 3.2. To make this happen in a reasonable way, we also had to drop support for Python versions earlier than 2.6.
This work was done by Michael Droettboom, the Cape Town Python Users’ Group, many others and supported financially in part by the SAGE project.
The following GUI backends work under Python 3.x: Gtk3Cairo, Qt4Agg, TkAgg and MacOSX. The other GUI backends do not yet have adequate bindings for Python 3.x, but continue to work on Python 2.6 and 2.7, particularly the Qt and QtAgg backends (which have been deprecated). The non-GUI backends, such as PDF, PS and SVG, work on both Python 2.x and 3.x.
Features that depend on the Python Imaging Library, such as JPEG handling, do not work, since the version of PIL for Python 3.x is not sufficiently mature.
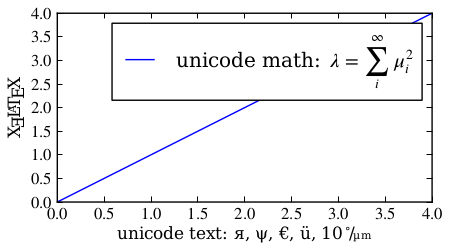
Peter Würtz wrote a backend that allows matplotlib to export figures as drawing commands for LaTeX. These can be processed by PdfLaTeX, XeLaTeX or LuaLaTeX using the PGF/TikZ package. Usage examples and documentation are found in Typesetting With XeLaTeX/LuaLaTeX.
Philip Elson exposed the intelligence behind the tick Locator classes with a simple interface. For instance, to get no more than 5 sensible steps which span the values 10 and 19.5:
>>> import matplotlib.ticker as mticker
>>> locator = mticker.MaxNLocator(nbins=5)
>>> print(locator.tick_values(10, 19.5))
[ 10.  12.  14.  16.  18.  20.]
Damon McDougall added a new plotting method for the
mplot3d toolkit called
plot_trisurf().
(Source code, png, hires.png, pdf)

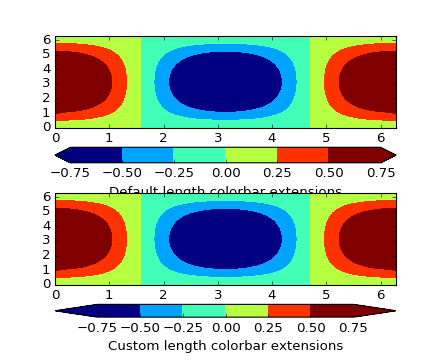
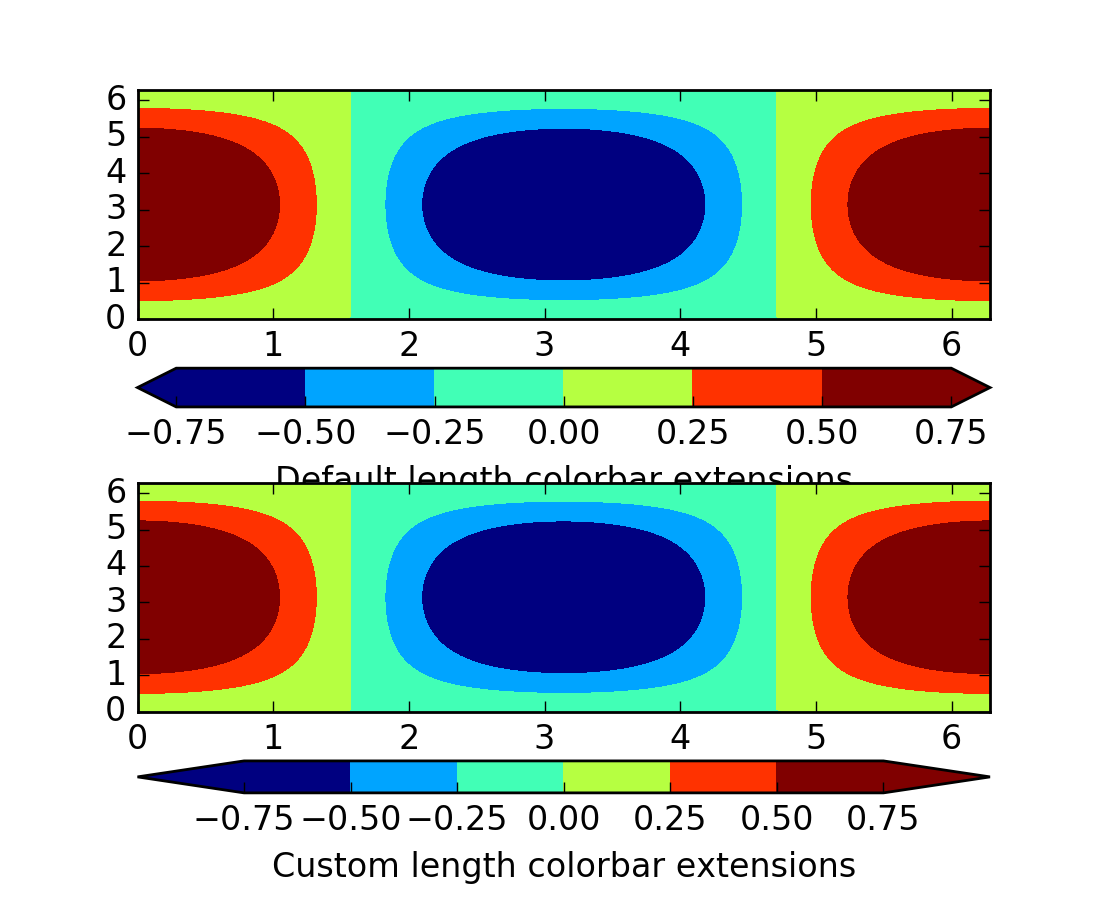
Andrew Dawson added a new keyword argument extendfrac to
colorbar() to control the length of
minimum and maximum colorbar extensions.
(Source code, png, hires.png, pdf)
Philip Elson added an experimental feature to make figures picklable for quick and easy short-term storage of plots. Pickle files are not designed for long term storage, are unsupported when restoring a pickle saved in another matplotlib version and are insecure when restoring a pickle from an untrusted source. Having said this, they are useful for short term storage for later modification inside matplotlib.
Two new defaults are available in the matplotlibrc configuration file:
savefig.bbox, which can be set to ‘standard’ or ‘tight’, and
savefig.pad_inches, which controls the bounding box padding.
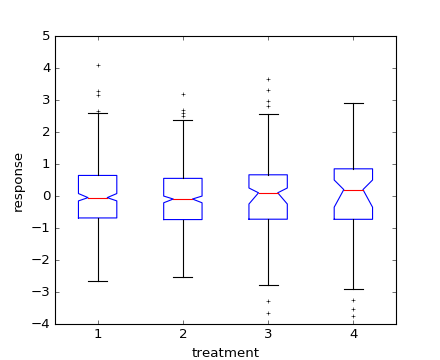
Users can now incorporate their own methods for computing the median and its
confidence intervals into the boxplot() method. For
every column of data passed to boxplot, the user can specify an accompanying
median and confidence interval.
(Source code, png, hires.png, pdf)
Matthew Emmett added a function and a context manager to help manage RC
parameters: rc_file() and rc_context.
To load RC parameters from a file:
>>> mpl.rc_file('mpl.rc')
To temporarily use RC parameters:
>>> with mpl.rc_context(fname='mpl.rc', rc={'text.usetex': True}):
>>>     ...
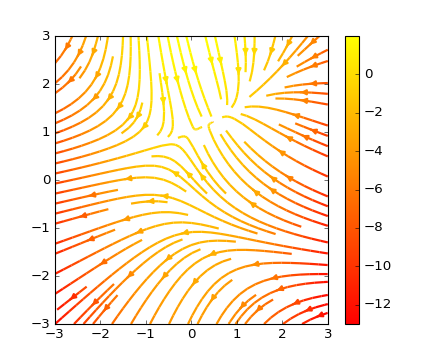
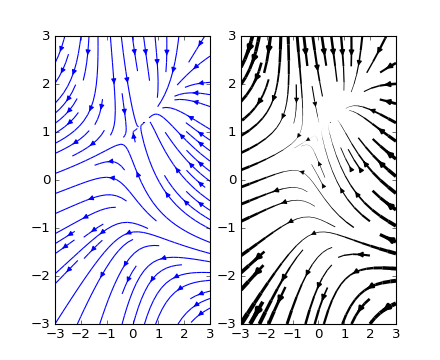
Tom Flannaghan and Tony Yu have added a new
streamplot() function to plot the streamlines of
a vector field. This has been a long-requested feature and complements the
existing quiver() function for plotting vector fields.
In addition to simply plotting the streamlines of the vector field,
streamplot() allows users to map the colors and/or
line widths of the streamlines to a separate parameter, such as the speed or
local intensity of the vector field.
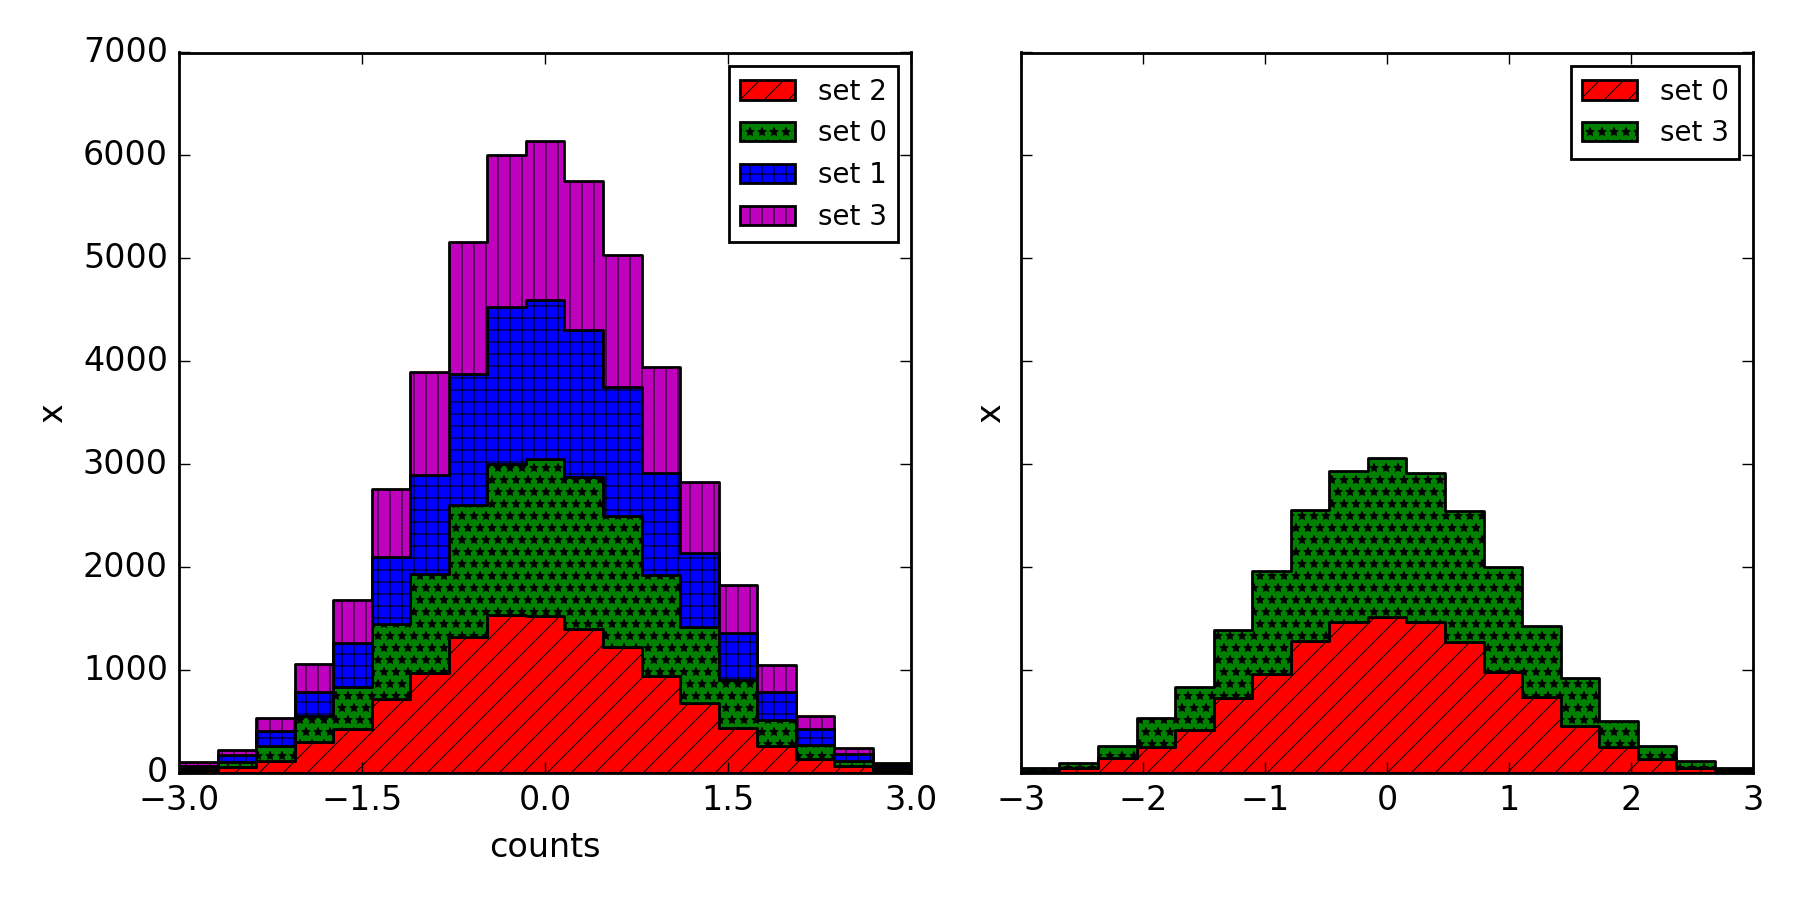
Nic Eggert added a new stacked kwarg to hist() that
allows creation of stacked histograms using any of the histogram types.
Previously, this functionality was only available by using the barstacked
histogram type. Now, when stacked=True is passed to the function, any of the
histogram types can be stacked. The barstacked histogram type retains its
previous functionality for backwards compatibility.
The following dependencies that ship with matplotlib and are optionally installed alongside it have been updated:
pytz2012ddateutil1.5 on Python 2.x, and 2.1 on Python 3.x
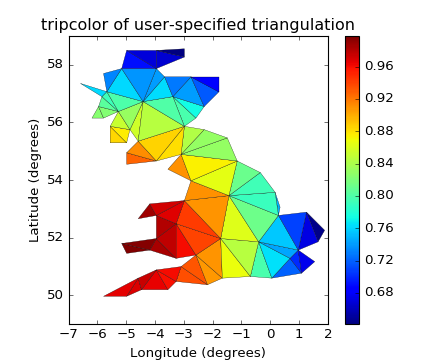
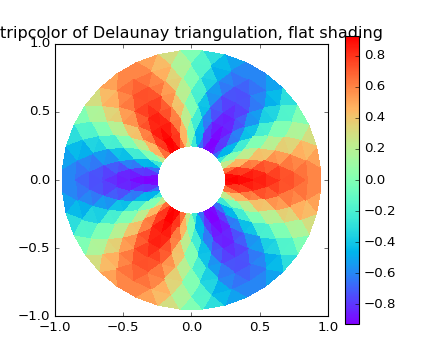
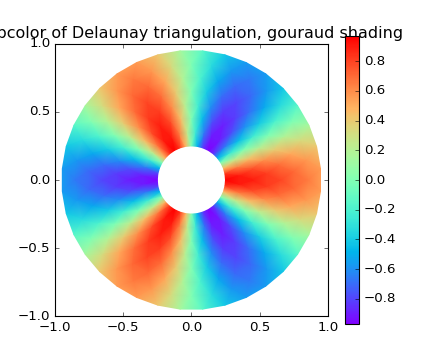
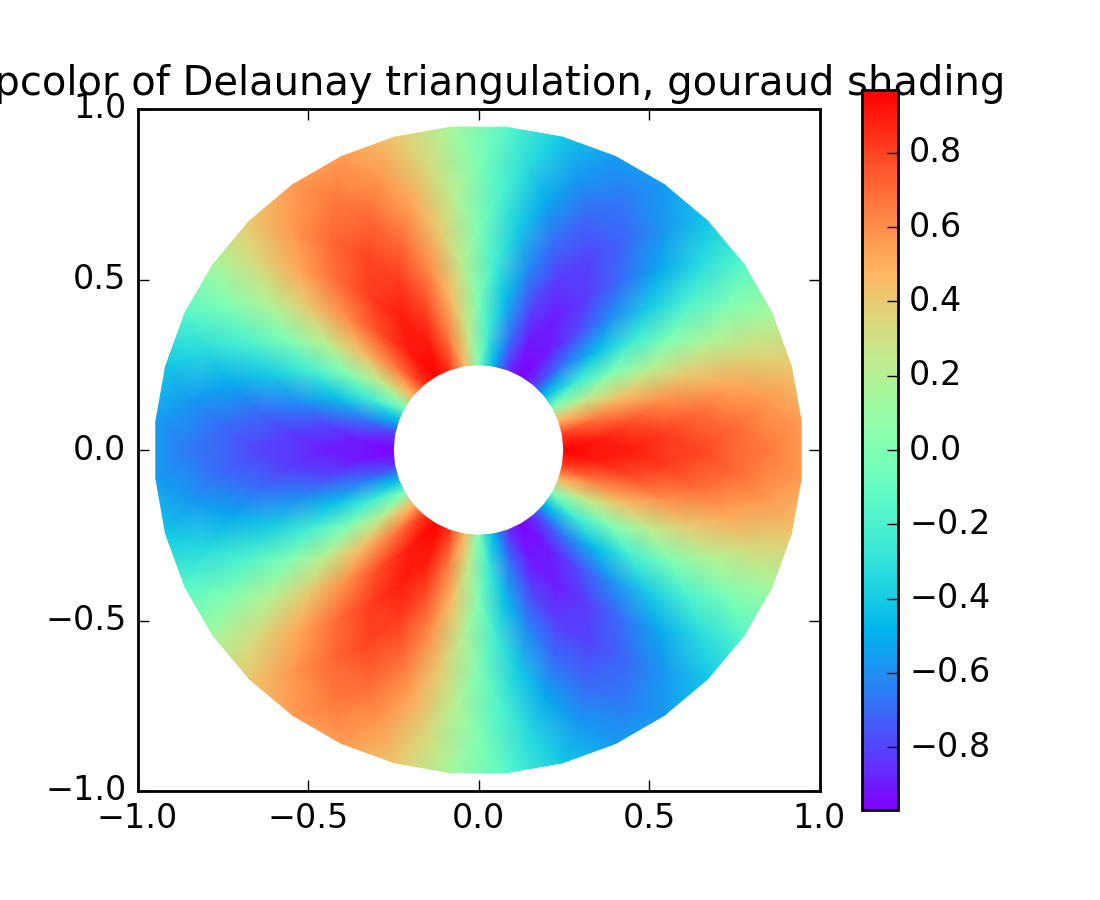
Ian Thomas extended tripcolor() to allow one color
value to be specified for each triangular face rather than for each point in
a triangulation.
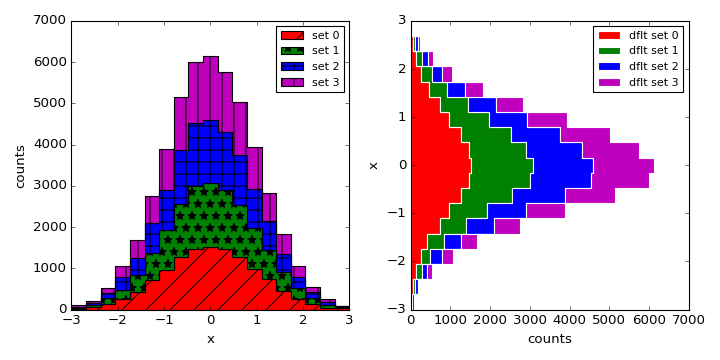
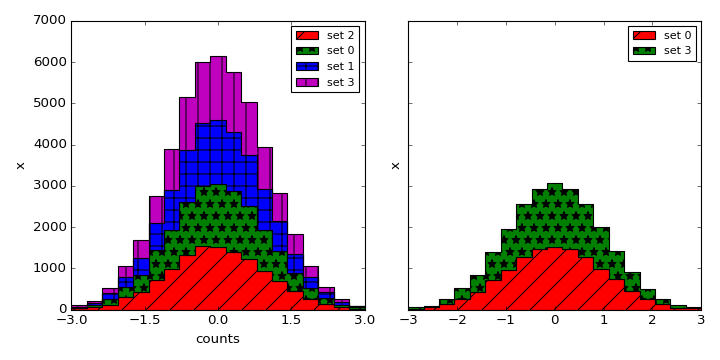
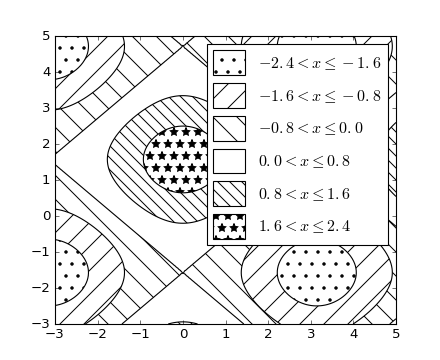
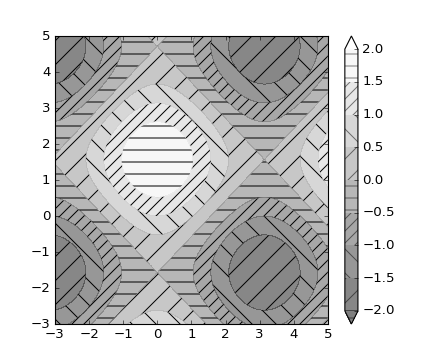
Phil Elson added support for hatching to
contourf(), together with the ability
to use a legend to identify contoured ranges.
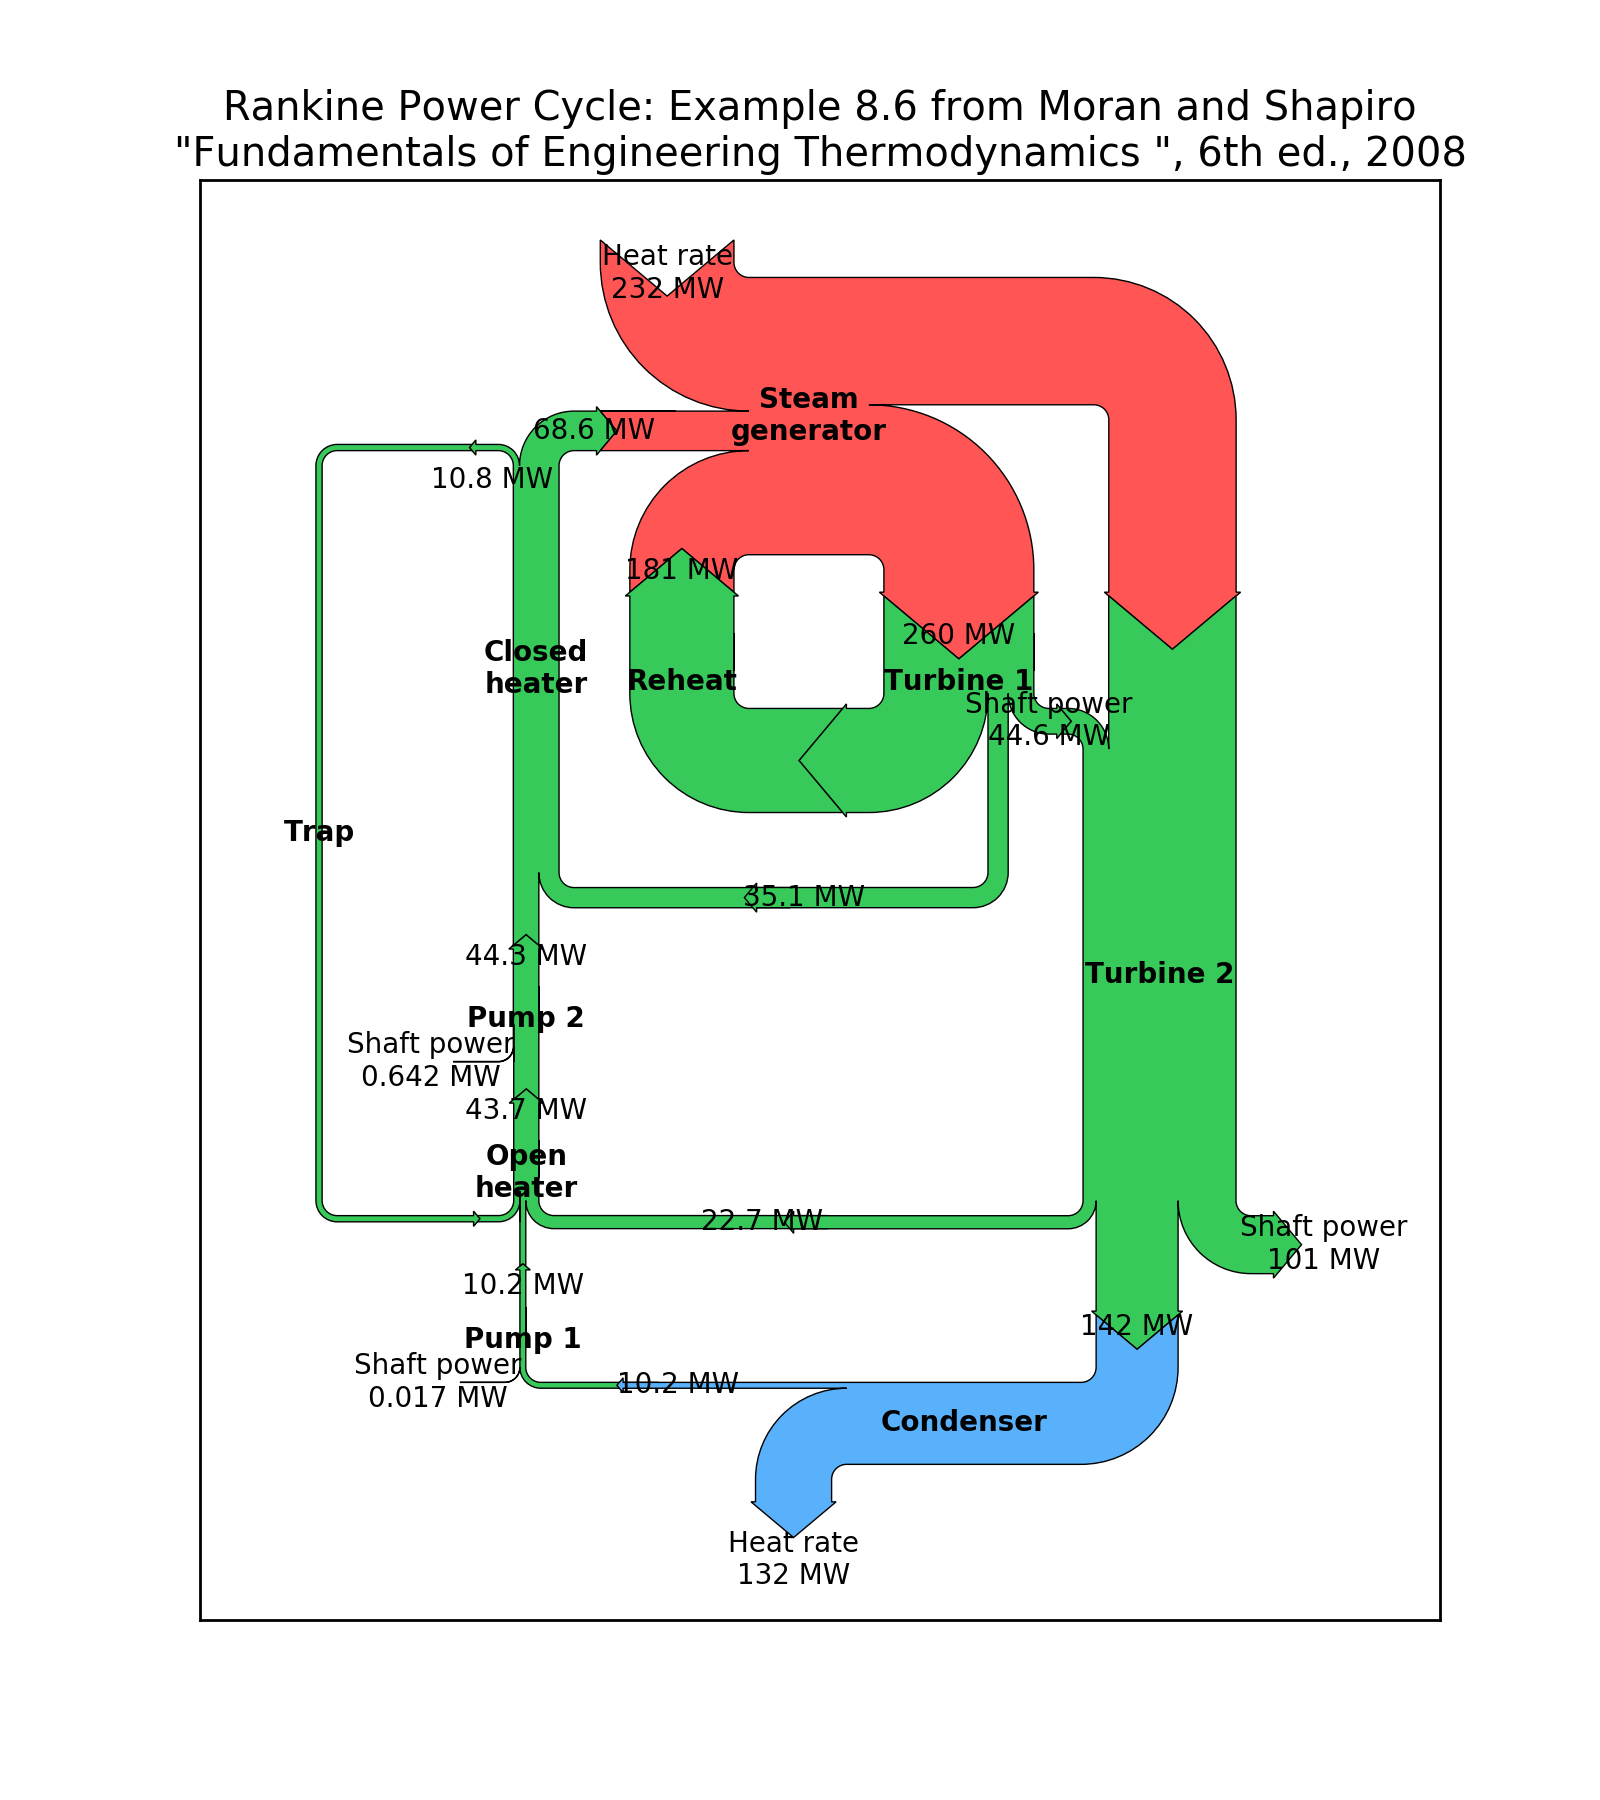
Kevin Davies has extended Yannick Copin’s original Sankey example into a module
(sankey) and provided new examples
(api example code: sankey_demo_basics.py, api example code: sankey_demo_links.py,
api example code: sankey_demo_rankine.py).
(Source code, png, hires.png, pdf)

Ryan May has written a backend-independent framework for creating
animated figures. The animation module is intended
to replace the backend-specific examples formerly in the
Matplotlib Examples listings. Examples using the new framework are
in animation Examples; see the entrancing double
pendulum which uses
matplotlib.animation.Animation.save() to create the movie below.
This should be considered as a beta release of the framework; please try it and provide feedback.
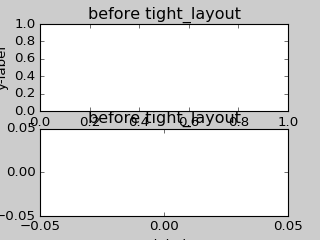
A frequent issue raised by users of matplotlib is the lack of a layout
engine to nicely space out elements of the plots. While matplotlib still
adheres to the philosophy of giving users complete control over the placement
of plot elements, Jae-Joon Lee created the tight_layout
module and introduced a new
command tight_layout()
to address the most common layout issues.
(Source code, png, hires.png, pdf)

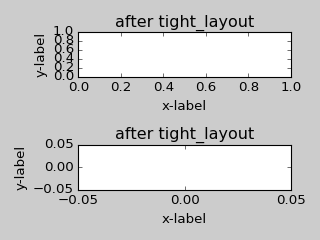
The usage of this functionality can be as simple as
plt.tight_layout()
and it will adjust the spacing between subplots so that the axis labels do not overlap with neighboring subplots. A Tight Layout guide has been created to show how to use this new tool.
Gerald Storer made the Qt4 backend compatible with PySide as well as PyQT4. At present, however, PySide does not support the PyOS_InputHook mechanism for handling gui events while waiting for text input, so it cannot be used with the new version 0.11 of IPython. Until this feature appears in PySide, IPython users should use the PyQT4 wrapper for QT4, which remains the matplotlib default.
An rcParam entry, “backend.qt4”, has been added to allow users to select PyQt4, PyQt4v2, or PySide. The latter two use the Version 2 Qt API. In most cases, users can ignore this rcParam variable; it is available to aid in testing, and to provide control for users who are embedding matplotlib in a PyQt4 or PySide app.
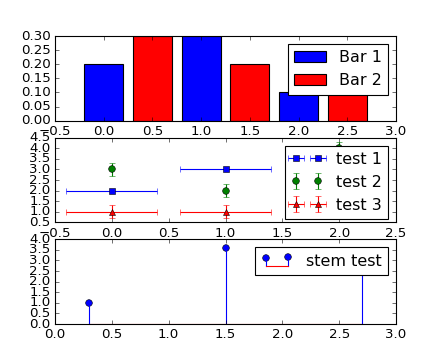
Jae-Joon Lee has improved plot legends. First,
legends for complex plots such as stem() plots
will now display correctly. Second, the ‘best’ placement of a legend has
been improved in the presence of NANs.
See the Legend guide for more detailed explanation and examples.
(Source code, png, hires.png, pdf)
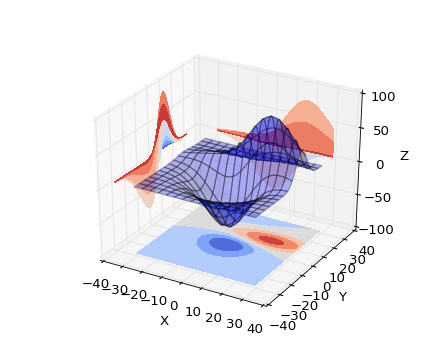
In continuing the efforts to make 3D plotting in matplotlib just as easy
as 2D plotting, Ben Root has made several improvements to the
mplot3d module.
Axes3D has been
improved to bring the class towards feature-parity with regular
Axes objects(Source code, png, hires.png, pdf)

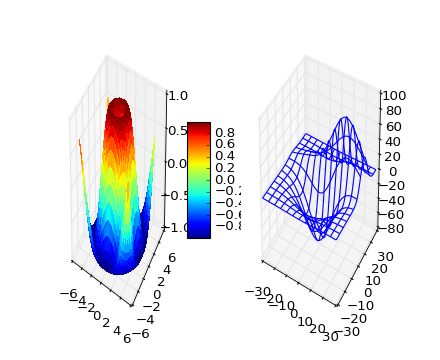
contourf()
gains zdir and offset kwargs. You can now do this:(Source code, png, hires.png, pdf)

After more than two years of deprecation warnings, Numerix support has now been completely removed from matplotlib.
The list of available markers for plot() and
scatter() has now been merged. While they
were mostly similar, some markers existed for one function, but not
the other. This merge did result in a conflict for the ‘d’ diamond
marker. Now, ‘d’ will be interpreted to always mean “thin” diamond
while ‘D’ will mean “regular” diamond.
Thanks to Michael Droettboom for this effort.
arrow()PolarAxes gains getters and setters for
“theta_direction”, and “theta_offset” to allow for theta to go in
either the clock-wise or counter-clockwise direction and to specify where zero
degrees should be placed.
set_theta_zero_location() is an
added convenience function.tripcolor()axes.labelweight parameter added to rcParams.imshow(), interpolation=’nearest’ will
now always perform an interpolation. A “none” option has been added to
indicate no interpolation at all.contour() now accepts a callable.
Thanks to Daniel Hyams for the original patch.HBox
and VBox classes.imshow().scatter() now accepts empty inputs.figure().Simon Ratcliffe and Ludwig Schwardt have released an HTML5/Canvas backend for matplotlib. The backend is almost feature complete, and they have done a lot of work comparing their html5 rendered images with our core renderer Agg. The backend features client/server interactive navigation of matplotlib figures in an html5 compliant browser.
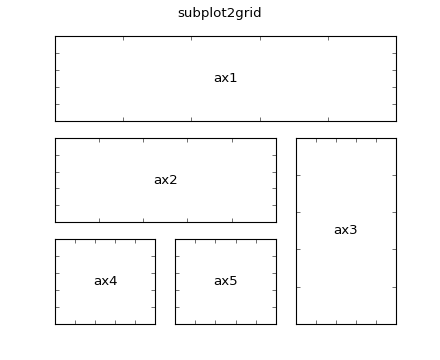
Jae-Joon Lee has written gridspec, a new module for
doing complex subplot layouts, featuring row and column spans and
more. See Customizing Location of Subplot Using GridSpec for a tutorial overview.
(Source code, png, hires.png, pdf)

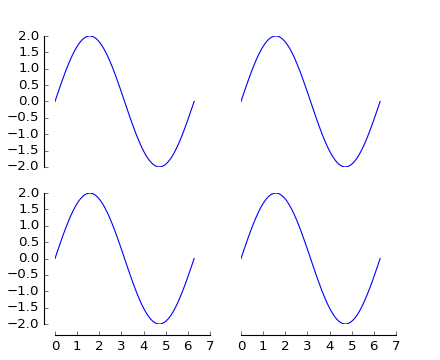
Fernando Perez got tired of all the boilerplate code needed to create a
figure and multiple subplots when using the matplotlib API, and wrote
a subplots() helper function. Basic usage
allows you to create the figure and an array of subplots with numpy
indexing (starts with 0). e.g.:
fig, axarr = plt.subplots(2, 2)
axarr[0,0].plot([1,2,3])   # upper, left
See pylab_examples example code: subplots_demo.py for several code examples.
Ian Thomas has fixed a long-standing bug that has vexed our most
talented developers for years. contourf()
now handles interior masked regions, and the boundaries of line and
filled contours coincide.
Additionally, he has contributed a new module tri and
helper function triplot() for creating and
plotting unstructured triangular grids.
A long standing request is to support multiple calls to
show(). This has been difficult because it
is hard to get consistent behavior across operating systems, user
interface toolkits and versions. Eric Firing has done a lot of work
on rationalizing show across backends, with the desired behavior to
make show raise all newly created figures and block execution until
they are closed. Repeated calls to show should raise newly created
figures since the last call. Eric has done a lot of testing on the
user interface toolkits and versions and platforms he has access to,
but it is not possible to test them all, so please report problems to
the mailing list
and bug tracker.
You can now place an mplot3d graph into an arbitrary axes location, supporting mixing of 2D and 3D graphs in the same figure, and/or multiple 3D graphs in a single figure, using the “projection” keyword argument to add_axes or add_subplot. Thanks Ben Root.
(Source code, png, hires.png, pdf)

Eric Firing wrote tick_params, a convenience method for changing the
appearance of ticks and tick labels. See pyplot function
tick_params() and associated Axes method
tick_params().
The matplotlib trunk is probably in as good a shape as it has ever been, thanks to improved software carpentry. We now have a buildbot which runs a suite of nose regression tests on every svn commit, auto-generating a set of images and comparing them against a set of known-goods, sending emails to developers on failures with a pixel-by-pixel image comparison. Releases and release bugfixes happen in branches, allowing active new feature development to happen in the trunk while keeping the release branches stable. Thanks to Andrew Straw, Michael Droettboom and other matplotlib developers for the heavy lifting.
Eric Firing went on a bug fixing and closing marathon, closing over 100 bugs on the bug tracker with help from Jae-Joon Lee, Michael Droettboom, Christoph Gohlke and Michiel de Hoon.
Jae-Joon Lee has written two new guides Legend guide and Annotating Axes. Michael Sarahan has written Image tutorial. John Hunter has written two new tutorials on working with paths and transformations: Path Tutorial and Transformations Tutorial.
Reinier Heeres has ported John Porter’s mplot3d over to the new matplotlib transformations framework, and it is now available as a toolkit mpl_toolkits.mplot3d (which now comes standard with all mpl installs). See mplot3d Examples and mplot3d tutorial
(Source code, png, hires.png, pdf)
Jae-Joon Lee has added a new toolkit to ease displaying multiple images in matplotlib, as well as some support for curvilinear grids to support the world coordinate system. The toolkit is included standard with all new mpl installs. See axes_grid Examples and The Matplotlib AxesGrid Toolkit User’s Guide.
(Source code, png, hires.png, pdf)
Andrew Straw has added the ability to place “axis spines” – the lines
that denote the data limits – in various arbitrary locations. No
longer are your axis lines constrained to be a simple rectangle around
the figure – you can turn on or off left, bottom, right and top, as
well as “detach” the spine to offset it away from the data. See
pylab_examples example code: spine_placement_demo.py and
matplotlib.spines.Spine.
(Source code, png, hires.png, pdf)
It’s been four months since the last matplotlib release, and there are a lot of new features and bug-fixes.
Thanks to Charlie Moad for testing and preparing the source release, including binaries for OS X and Windows for python 2.4 and 2.5 (2.6 and 3.0 will not be available until numpy is available on those releases). Thanks to the many developers who contributed to this release, with contributions from Jae-Joon Lee, Michael Droettboom, Ryan May, Eric Firing, Manuel Metz, Jouni K. Seppänen, Jeff Whitaker, Darren Dale, David Kaplan, Michiel de Hoon and many others who submitted patches
Jae-Joon has rewritten the legend class, and added support for
multiple columns and rows, as well as fancy box drawing. See
legend() and
matplotlib.legend.Legend.
(Source code, png, hires.png, pdf)

Jae-Joon has added lots of support to annotations for drawing fancy
boxes and connectors in annotations. See
annotate() and
BoxStyle,
ArrowStyle, and
ConnectionStyle.
(Source code, png, hires.png, pdf)

Michiel de Hoon has provided a native Mac OSX backend that is almost completely implemented in C. The backend can therefore use Quartz directly and, depending on the application, can be orders of magnitude faster than the existing backends. In addition, no third-party libraries are needed other than Python and NumPy. The backend is interactive from the usual terminal application on Mac using regular Python. It hasn’t been tested with ipython yet, but in principle it should to work there as well. Set ‘backend : macosx’ in your matplotlibrc file, or run your script with:
> python myfile.py -dmacosx
Ryan May did a lot of work to rationalize the amplitude scaling of
psd() and friends. See
pylab_examples example code: psd_demo2.py. and pylab_examples example code: psd_demo3.py.
The changes should increase MATLAB
compatibility and increase scaling options.
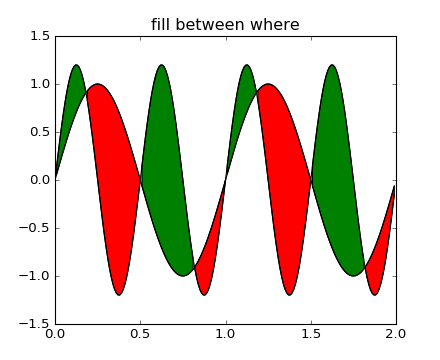
Added a fill_between() function to make it
easier to do shaded region plots in the presence of masked data. You
can pass an x array and a ylower and yupper array to fill
between, and an optional where argument which is a logical mask
where you want to do the filling.
(Source code, png, hires.png, pdf)
Here are the 0.98.4 notes from the CHANGELOG:
Added mdehoon's native macosx backend from sf patch 2179017 - JDH

Removed the prints in the set_*style commands.  Return the list of
pretty-printed strings instead - JDH

Some of the changes Michael made to improve the output of the
property tables in the rest docs broke of made difficult to use
some of the interactive doc helpers, e.g., setp and getp.  Having all
the rest markup in the ipython shell also confused the docstrings.
I added a new rc param docstring.harcopy, to format the docstrings
differently for hardcopy and other use.  The ArtistInspector
could use a little refactoring now since there is duplication of
effort between the rest out put and the non-rest output - JDH

Updated spectral methods (psd, csd, etc.) to scale one-sided
densities by a factor of 2 and, optionally, scale all densities by
the sampling frequency.  This gives better MATLAB
compatibility. -RM

Fixed alignment of ticks in colorbars. -MGD

drop the deprecated "new" keyword of np.histogram() for numpy 1.2
or later.  -JJL

Fixed a bug in svg backend that new_figure_manager() ignores
keywords arguments such as figsize, etc. -JJL

Fixed a bug that the handlelength of the new legend class set too
short when numpoints=1 -JJL

Added support for data with units (e.g., dates) to
Axes.fill_between. -RM

Added fancybox keyword to legend. Also applied some changes for
better look, including baseline adjustment of the multiline texts
so that it is center aligned. -JJL

The transmuter classes in the patches.py are reorganized as
subclasses of the Style classes. A few more box and arrow styles
are added. -JJL

Fixed a bug in the new legend class that didn't allowed a tuple of
coordinate values as loc. -JJL

Improve checks for external dependencies, using subprocess
(instead of deprecated popen*) and distutils (for version
checking) - DSD

Reimplementation of the legend which supports baseline alignment,
multi-column, and expand mode. - JJL

Fixed histogram autoscaling bug when bins or range are given
explicitly (fixes Debian bug 503148) - MM

Added rcParam axes.unicode_minus which allows plain hyphen for
minus when False - JDH

Added scatterpoints support in Legend. patch by Erik Tollerud -
JJL

Fix crash in log ticking. - MGD

Added static helper method BrokenHBarCollection.span_where and
Axes/pyplot method fill_between.  See
examples/pylab/fill_between.py - JDH

Add x_isdata and y_isdata attributes to Artist instances, and use
them to determine whether either or both coordinates are used when
updating dataLim.  This is used to fix autoscaling problems that
had been triggered by axhline, axhspan, axvline, axvspan. - EF

Update the psd(), csd(), cohere(), and specgram() methods of Axes
and the csd() cohere(), and specgram() functions in mlab to be in
sync with the changes to psd().  In fact, under the hood, these
all call the same core to do computations. - RM

Add 'pad_to' and 'sides' parameters to mlab.psd() to allow
controlling of zero padding and returning of negative frequency
components, respectively.  These are added in a way that does not
change the API. - RM

Fix handling of c kwarg by scatter; generalize is_string_like to
accept numpy and numpy.ma string array scalars. - RM and EF

Fix a possible EINTR problem in dviread, which might help when
saving pdf files from the qt backend. - JKS

Fix bug with zoom to rectangle and twin axes - MGD

Added Jae Joon's fancy arrow, box and annotation enhancements --
see examples/pylab_examples/annotation_demo2.py

Autoscaling is now supported with shared axes - EF

Fixed exception in dviread that happened with Minion - JKS

set_xlim, ylim now return a copy of the viewlim array to avoid
modify inplace surprises

Added image thumbnail generating function
matplotlib.image.thumbnail.  See examples/misc/image_thumbnail.py
- JDH

Applied scatleg patch based on ideas and work by Erik Tollerud and
Jae-Joon Lee. - MM

Fixed bug in pdf backend: if you pass a file object for output
instead of a filename, e.g., in a wep app, we now flush the object
at the end. - JKS

Add path simplification support to paths with gaps. - EF

Fix problem with AFM files that don't specify the font's full name
or family name. - JKS

Added 'scilimits' kwarg to Axes.ticklabel_format() method, for
easy access to the set_powerlimits method of the major
ScalarFormatter. - EF

Experimental new kwarg borderpad to replace pad in legend, based
on suggestion by Jae-Joon Lee.  - EF

Allow spy to ignore zero values in sparse arrays, based on patch
by Tony Yu.  Also fixed plot to handle empty data arrays, and
fixed handling of markers in figlegend. - EF

Introduce drawstyles for lines. Transparently split linestyles
like 'steps--' into drawstyle 'steps' and linestyle '--'.  Legends
always use drawstyle 'default'. - MM

Fixed quiver and quiverkey bugs (failure to scale properly when
resizing) and added additional methods for determining the arrow
angles - EF

Fix polar interpolation to handle negative values of theta - MGD

Reorganized cbook and mlab methods related to numerical
calculations that have little to do with the goals of those two
modules into a separate module numerical_methods.py Also, added
ability to select points and stop point selection with keyboard in
ginput and manual contour labeling code.  Finally, fixed contour
labeling bug. - DMK

Fix backtick in Postscript output. - MGD

[ 2089958 ] Path simplification for vector output backends
Leverage the simplification code exposed through path_to_polygons
to simplify certain well-behaved paths in the vector backends
(PDF, PS and SVG).  "path.simplify" must be set to True in
matplotlibrc for this to work.  - MGD

Add "filled" kwarg to Path.intersects_path and
Path.intersects_bbox. - MGD

Changed full arrows slightly to avoid an xpdf rendering problem
reported by Friedrich Hagedorn. - JKS

Fix conversion of quadratic to cubic Bezier curves in PDF and PS
backends. Patch by Jae-Joon Lee. - JKS

Added 5-point star marker to plot command q- EF

Fix hatching in PS backend - MGD

Fix log with base 2 - MGD

Added support for bilinear interpolation in
NonUniformImage; patch by Gregory Lielens. - EF

Added support for multiple histograms with data of
different length - MM

Fix step plots with log scale - MGD

Fix masked arrays with markers in non-Agg backends - MGD

Fix clip_on kwarg so it actually works correctly - MGD

Fix locale problems in SVG backend - MGD

fix quiver so masked values are not plotted - JSW

improve interactive pan/zoom in qt4 backend on windows - DSD

Fix more bugs in NaN/inf handling.  In particular, path
simplification (which does not handle NaNs or infs) will be turned
off automatically when infs or NaNs are present.  Also masked
arrays are now converted to arrays with NaNs for consistent
handling of masks and NaNs - MGD and EF

Added support for arbitrary rasterization resolutions to the SVG
backend. - MW


