Learn what to expect in the new updates

"""
Reference for colormaps included with Matplotlib.
This reference example shows all colormaps included with Matplotlib. Note that
any colormap listed here can be reversed by appending "_r" (e.g., "pink_r").
These colormaps are divided into the following categories:
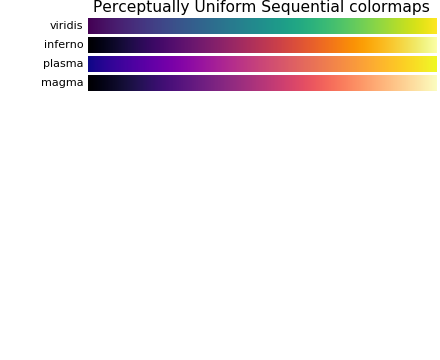
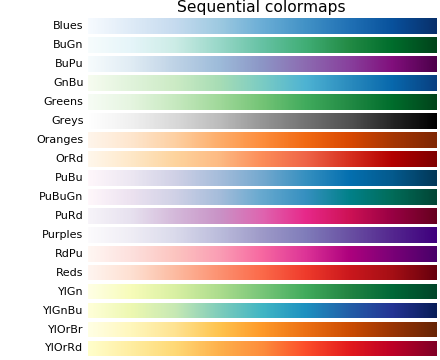
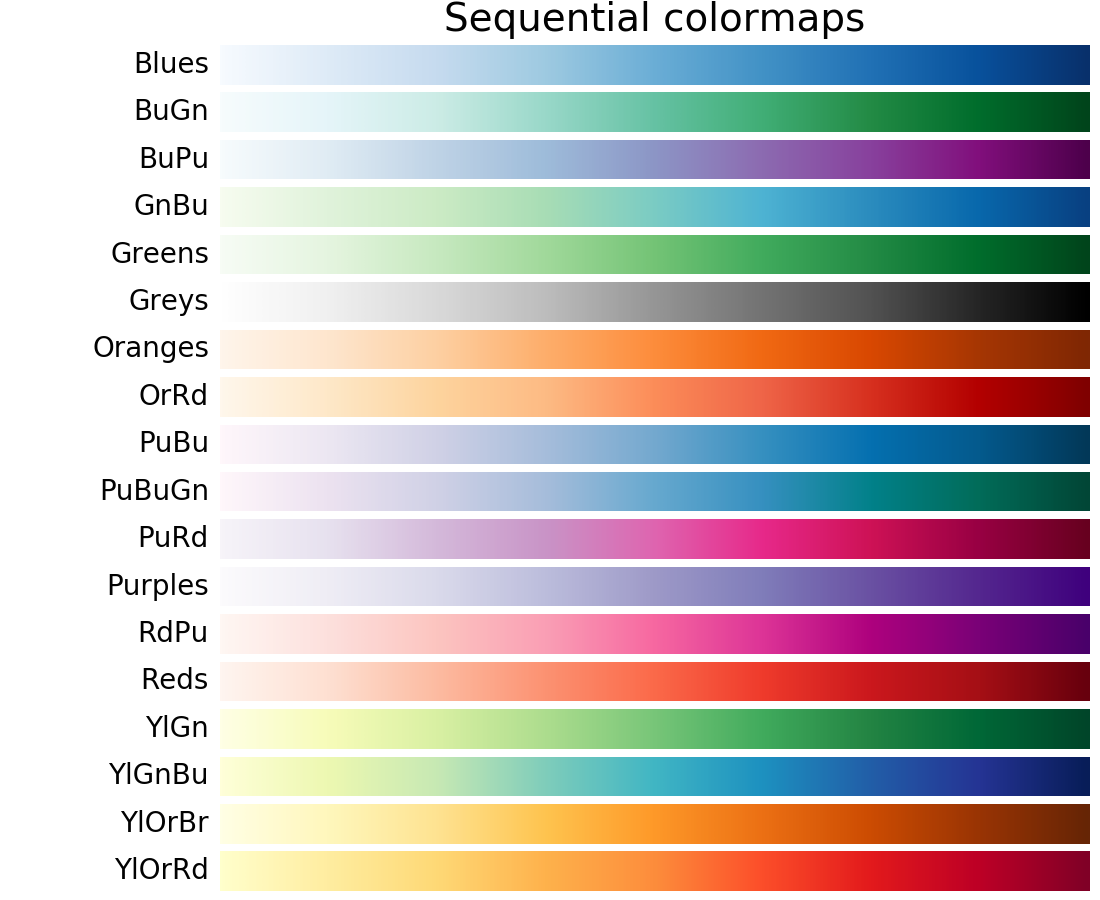
Sequential:
These colormaps are approximately monochromatic colormaps varying smoothly
between two color tones---usually from low saturation (e.g. white) to high
saturation (e.g. a bright blue). Sequential colormaps are ideal for
representing most scientific data since they show a clear progression from
low-to-high values.
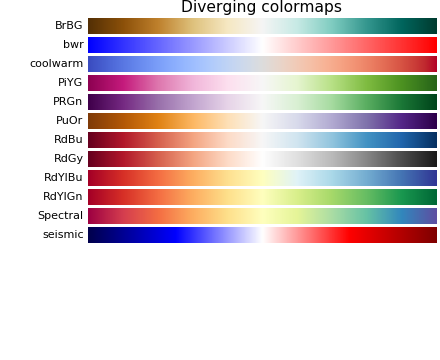
Diverging:
These colormaps have a median value (usually light in color) and vary
smoothly to two different color tones at high and low values. Diverging
colormaps are ideal when your data has a median value that is significant
(e.g. 0, such that positive and negative values are represented by
different colors of the colormap).
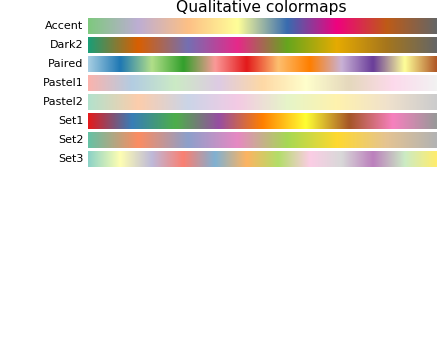
Qualitative:
These colormaps vary rapidly in color. Qualitative colormaps are useful for
choosing a set of discrete colors. For example::
color_list = plt.cm.Set3(np.linspace(0, 1, 12))
gives a list of RGB colors that are good for plotting a series of lines on
a dark background.
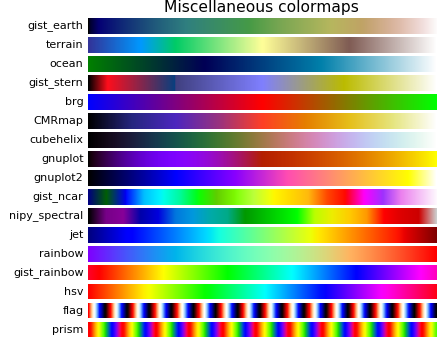
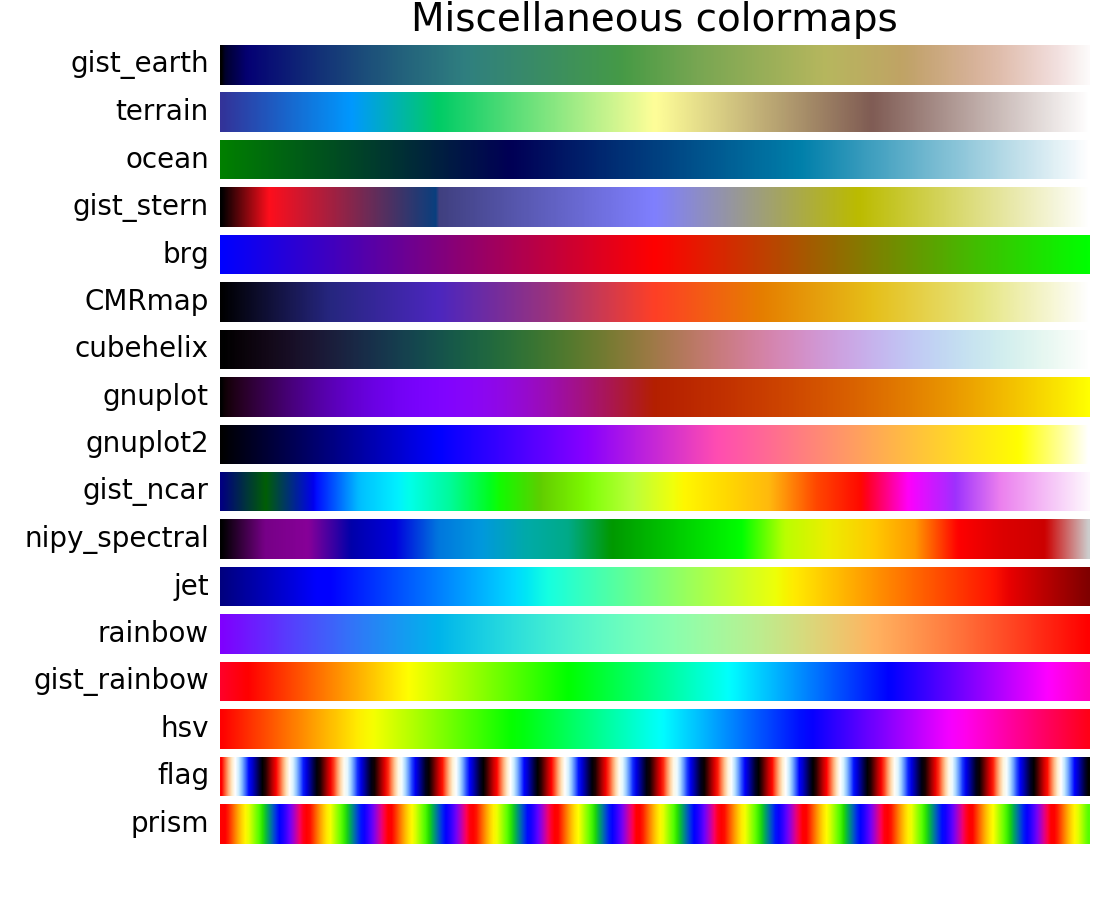
Miscellaneous:
Colormaps that don't fit into the categories above.
"""
import numpy as np
import matplotlib.pyplot as plt
# Have colormaps separated into categories:
# http://matplotlib.org/examples/color/colormaps_reference.html
cmaps = [('Perceptually Uniform Sequential',
['viridis', 'inferno', 'plasma', 'magma']),
('Sequential', ['Blues', 'BuGn', 'BuPu',
'GnBu', 'Greens', 'Greys', 'Oranges', 'OrRd',
'PuBu', 'PuBuGn', 'PuRd', 'Purples', 'RdPu',
'Reds', 'YlGn', 'YlGnBu', 'YlOrBr', 'YlOrRd']),
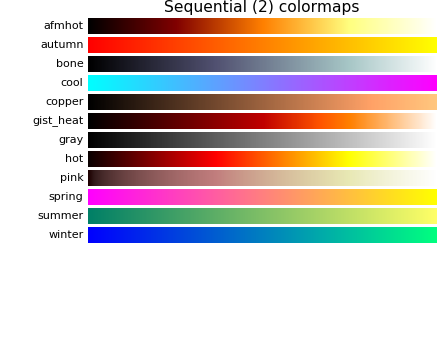
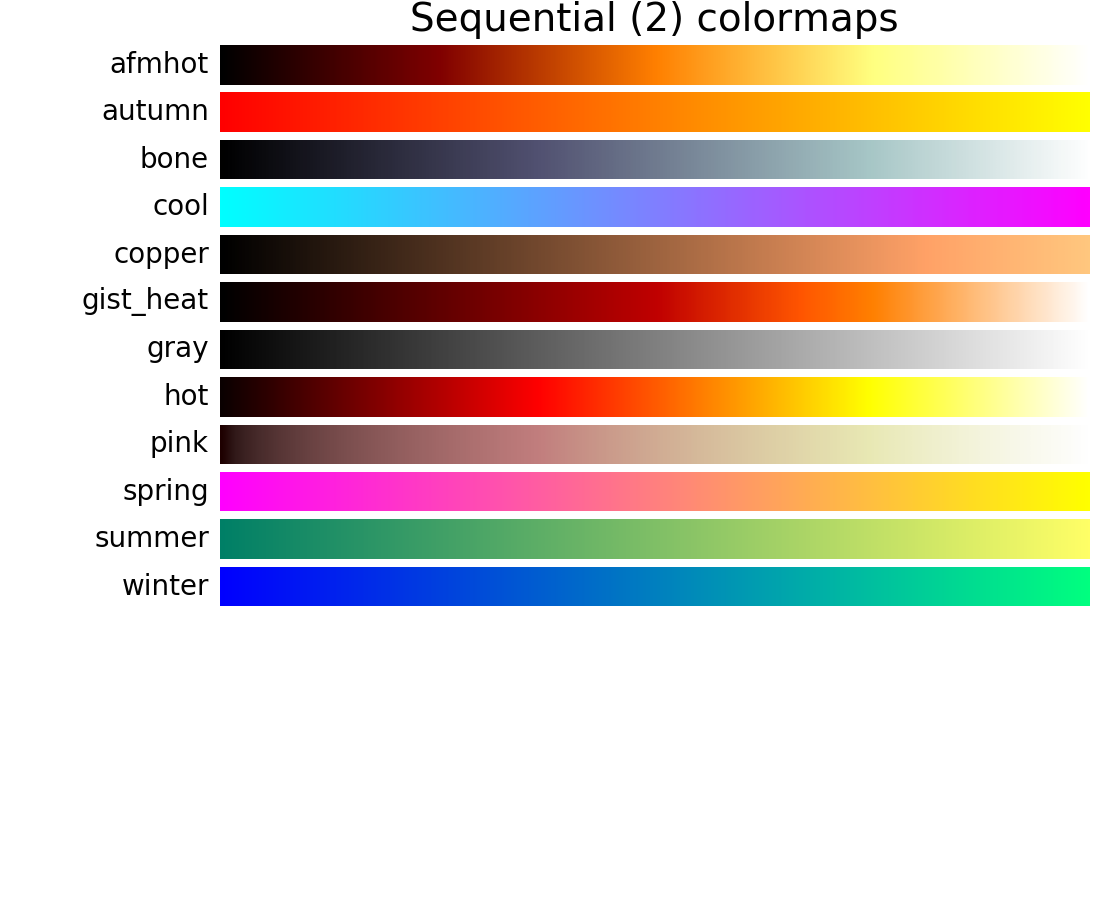
('Sequential (2)', ['afmhot', 'autumn', 'bone', 'cool',
'copper', 'gist_heat', 'gray', 'hot',
'pink', 'spring', 'summer', 'winter']),
('Diverging', ['BrBG', 'bwr', 'coolwarm', 'PiYG', 'PRGn', 'PuOr',
'RdBu', 'RdGy', 'RdYlBu', 'RdYlGn', 'Spectral',
'seismic']),
('Qualitative', ['Accent', 'Dark2', 'Paired', 'Pastel1',
'Pastel2', 'Set1', 'Set2', 'Set3']),
('Miscellaneous', ['gist_earth', 'terrain', 'ocean', 'gist_stern',
'brg', 'CMRmap', 'cubehelix',
'gnuplot', 'gnuplot2', 'gist_ncar',
'nipy_spectral', 'jet', 'rainbow',
'gist_rainbow', 'hsv', 'flag', 'prism'])]
nrows = max(len(cmap_list) for cmap_category, cmap_list in cmaps)
gradient = np.linspace(0, 1, 256)
gradient = np.vstack((gradient, gradient))
def plot_color_gradients(cmap_category, cmap_list):
fig, axes = plt.subplots(nrows=nrows)
fig.subplots_adjust(top=0.95, bottom=0.01, left=0.2, right=0.99)
axes[0].set_title(cmap_category + ' colormaps', fontsize=14)
for ax, name in zip(axes, cmap_list):
ax.imshow(gradient, aspect='auto', cmap=plt.get_cmap(name))
pos = list(ax.get_position().bounds)
x_text = pos[0] - 0.01
y_text = pos[1] + pos[3]/2.
fig.text(x_text, y_text, name, va='center', ha='right', fontsize=10)
# Turn off *all* ticks & spines, not just the ones with colormaps.
for ax in axes:
ax.set_axis_off()
for cmap_category, cmap_list in cmaps:
plot_color_gradients(cmap_category, cmap_list)
plt.show()
Keywords: python, matplotlib, pylab, example, codex (see Search examples)

