matplotlib.colors.SymLogNorm#
- class matplotlib.colors.SymLogNorm(linthresh, linscale=1.0, vmin=None, vmax=None, clip=False, *, base=10)[source]#
Bases:
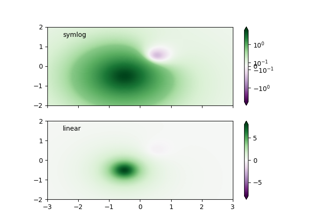
SymLogNormThe symmetrical logarithmic scale is logarithmic in both the positive and negative directions from the origin.
Since the values close to zero tend toward infinity, there is a need to have a range around zero that is linear. The parameter linthresh allows the user to specify the size of this range (-linthresh, linthresh).
- Parameters:
- linthreshfloat
The range within which the plot is linear (to avoid having the plot go to infinity around zero).
- linscalefloat, default: 1
This allows the linear range (-linthresh to linthresh) to be stretched relative to the logarithmic range. Its value is the number of decades to use for each half of the linear range. For example, when linscale == 1.0 (the default), the space used for the positive and negative halves of the linear range will be equal to one decade in the logarithmic range.
- basefloat, default: 10
- Parameters:
- vmin, vmaxfloat or None
Values within the range
[vmin, vmax]from the input data will be linearly mapped to[0, 1]. If either vmin or vmax is not provided, they default to the minimum and maximum values of the input, respectively.- clipbool, default: False
Determines the behavior for mapping values outside the range
[vmin, vmax].If clipping is off, values outside the range
[vmin, vmax]are also transformed, resulting in values outside[0, 1]. This behavior is usually desirable, as colormaps can mark these under and over values with specific colors.If clipping is on, values below vmin are mapped to 0 and values above vmax are mapped to 1. Such values become indistinguishable from regular boundary values, which may cause misinterpretation of the data.
Notes
If
vmin == vmax, input data will be mapped to 0.- __call__(value, clip=None)[source]#
Normalize the data and return the normalized data.
- Parameters:
- value
Data to normalize.
- clipbool, optional
See the description of the parameter clip in
Normalize.If
None, defaults toself.clip(which defaults toFalse).
Notes
If not already initialized,
self.vminandself.vmaxare initialized usingself.autoscale_None(value).