matplotlib.colors.AsinhNorm#
- class matplotlib.colors.AsinhNorm(linear_width=1, vmin=None, vmax=None, clip=False)[source]#
Bases:
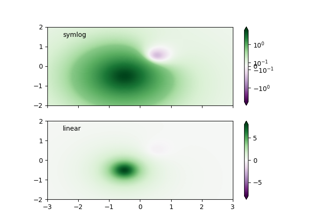
AsinhNormThe inverse hyperbolic sine scale is approximately linear near the origin, but becomes logarithmic for larger positive or negative values. Unlike the
SymLogNorm, the transition between these linear and logarithmic regions is smooth, which may reduce the risk of visual artifacts.Note
This API is provisional and may be revised in the future based on early user feedback.
- Parameters:
- linear_widthfloat, default: 1
The effective width of the linear region, beyond which the transformation becomes asymptotically logarithmic
- Parameters:
- vmin, vmaxfloat or None
Values within the range
[vmin, vmax]from the input data will be linearly mapped to[0, 1]. If either vmin or vmax is not provided, they default to the minimum and maximum values of the input, respectively.- clipbool, default: False
Determines the behavior for mapping values outside the range
[vmin, vmax].If clipping is off, values outside the range
[vmin, vmax]are also transformed, resulting in values outside[0, 1]. This behavior is usually desirable, as colormaps can mark these under and over values with specific colors.If clipping is on, values below vmin are mapped to 0 and values above vmax are mapped to 1. Such values become indistinguishable from regular boundary values, which may cause misinterpretation of the data.
Notes
If
vmin == vmax, input data will be mapped to 0.- __call__(value, clip=None)[source]#
Normalize the data and return the normalized data.
- Parameters:
- value
Data to normalize.
- clipbool, optional
See the description of the parameter clip in
Normalize.If
None, defaults toself.clip(which defaults toFalse).
Notes
If not already initialized,
self.vminandself.vmaxare initialized usingself.autoscale_None(value).