mpl-probscale: Real probability scales for matplotlib

https://github.com/matplotlib/mpl-probscale
Installation
Official releases
Official releases are available through the conda-forge channel or pip:
conda install mpl-probscale --channel=conda-forge
or
pip install probscale
Development builds
This is a pure-python package, so building from source is easy on all platforms:
git clone [email protected]:matplotlib/mpl-probscale.git
cd mpl-probscale
pip install -e .
Quickstart
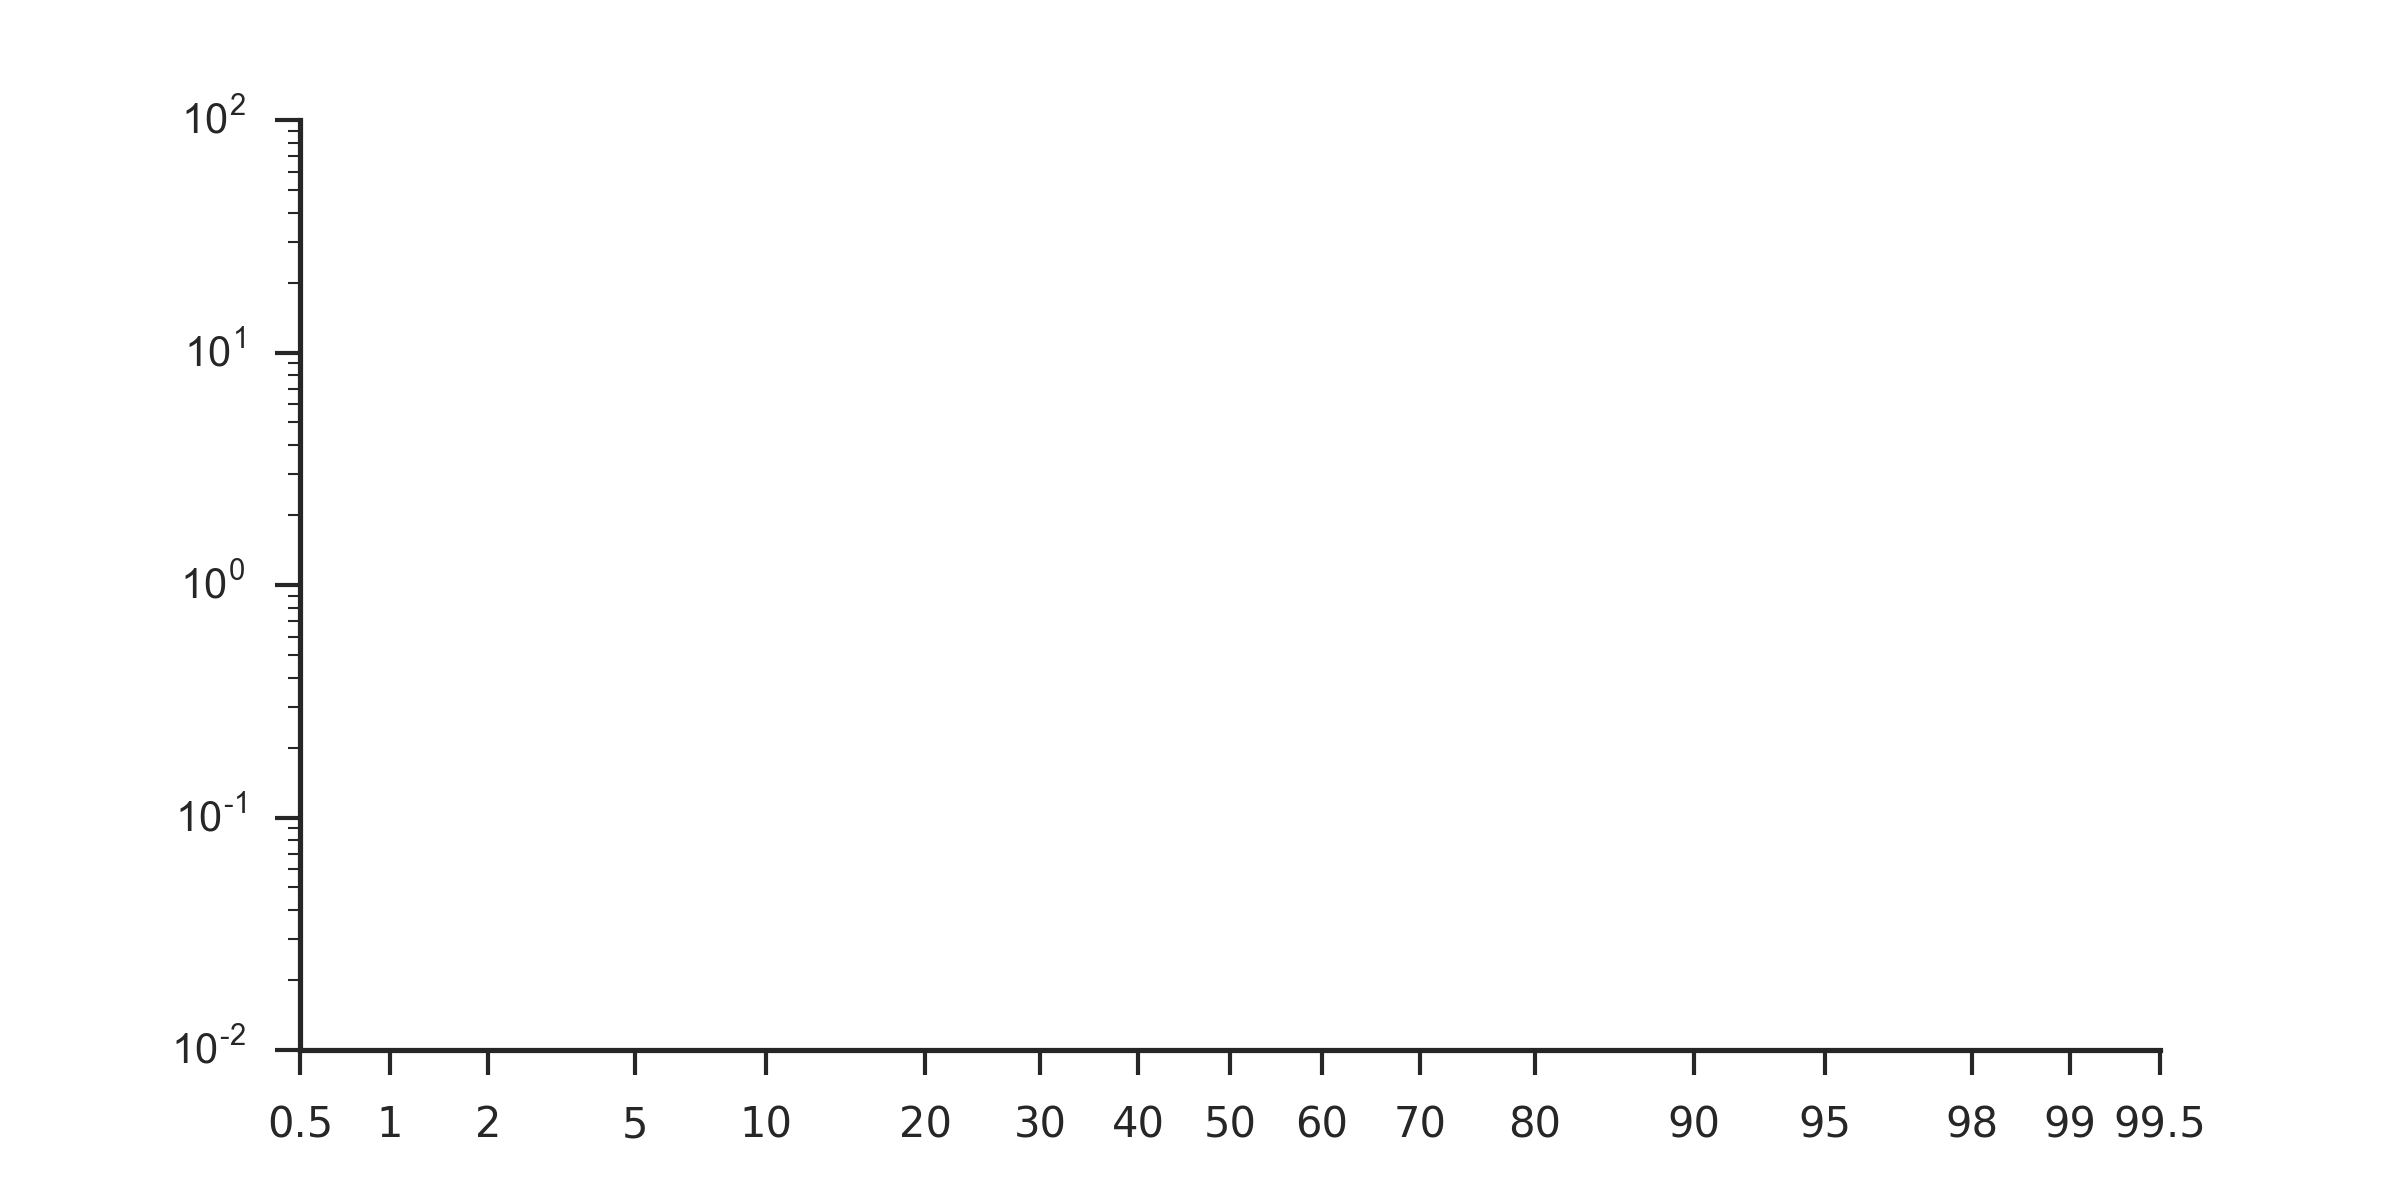
Simply importing probscale lets you use probability scales in your matplotlib figures:
import matplotlib.pyplot as plt
import probscale
import seaborn
clear_bkgd = {'axes.facecolor':'none', 'figure.facecolor':'none'}
seaborn.set(style='ticks', context='notebook', rc=clear_bkgd)

fig, ax = plt.subplots(figsize=(8, 4))
ax.set_ylim(1e-2, 1e2)
ax.set_yscale('log')

ax.set_xlim(0.5, 99.5)
ax.set_xscale('prob')
seaborn.despine(fig=fig)
Tutorials
Testing
It’s easiest to run the tests from an interactive python session:
import matplotlib
matplotlib.use('agg')
import probscale
probscale.test()