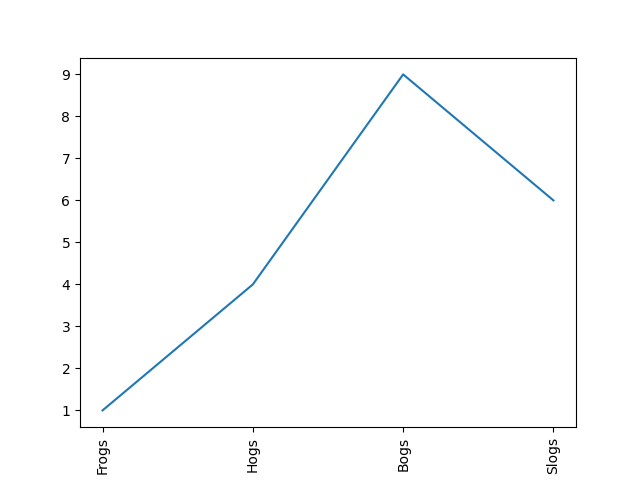
Demo of custom tick-labels with user-defined rotation.
importmatplotlib.pyplotaspltx=[1,2,3,4]y=[1,4,9,6]labels=['Frogs','Hogs','Bogs','Slogs']fig,ax=plt.subplots()ax.plot(x,y)# You can specify a rotation for the tick labels in degrees or with keywords.ax.set_xticks(x,labels,rotation='vertical')plt.show()