Note
Go to the end to download the full example code.
Multicolored lines#
The example shows two ways to plot a line with the a varying color defined by a third value. The first example defines the color at each (x, y) point. The second example defines the color between pairs of points, so the length of the color value list is one less than the length of the x and y lists.
Color values at points#
import warnings
import matplotlib.pyplot as plt
import numpy as np
from matplotlib.collections import LineCollection
def colored_line(x, y, c, ax, **lc_kwargs):
"""
Plot a line with a color specified along the line by a third value.
It does this by creating a collection of line segments. Each line segment is
made up of two straight lines each connecting the current (x, y) point to the
midpoints of the lines connecting the current point with its two neighbors.
This creates a smooth line with no gaps between the line segments.
Parameters
----------
x, y : array-like
The horizontal and vertical coordinates of the data points.
c : array-like
The color values, which should be the same size as x and y.
ax : Axes
Axis object on which to plot the colored line.
**lc_kwargs
Any additional arguments to pass to matplotlib.collections.LineCollection
constructor. This should not include the array keyword argument because
that is set to the color argument. If provided, it will be overridden.
Returns
-------
matplotlib.collections.LineCollection
The generated line collection representing the colored line.
"""
if "array" in lc_kwargs:
warnings.warn('The provided "array" keyword argument will be overridden')
# Default the capstyle to butt so that the line segments smoothly line up
default_kwargs = {"capstyle": "butt"}
default_kwargs.update(lc_kwargs)
# Compute the midpoints of the line segments. Include the first and last points
# twice so we don't need any special syntax later to handle them.
x = np.asarray(x)
y = np.asarray(y)
x_midpts = np.hstack((x[0], 0.5 * (x[1:] + x[:-1]), x[-1]))
y_midpts = np.hstack((y[0], 0.5 * (y[1:] + y[:-1]), y[-1]))
# Determine the start, middle, and end coordinate pair of each line segment.
# Use the reshape to add an extra dimension so each pair of points is in its
# own list. Then concatenate them to create:
# [
# [(x1_start, y1_start), (x1_mid, y1_mid), (x1_end, y1_end)],
# [(x2_start, y2_start), (x2_mid, y2_mid), (x2_end, y2_end)],
# ...
# ]
coord_start = np.column_stack((x_midpts[:-1], y_midpts[:-1]))[:, np.newaxis, :]
coord_mid = np.column_stack((x, y))[:, np.newaxis, :]
coord_end = np.column_stack((x_midpts[1:], y_midpts[1:]))[:, np.newaxis, :]
segments = np.concatenate((coord_start, coord_mid, coord_end), axis=1)
lc = LineCollection(segments, **default_kwargs)
lc.set_array(c) # set the colors of each segment
return ax.add_collection(lc)
# -------------- Create and show plot --------------
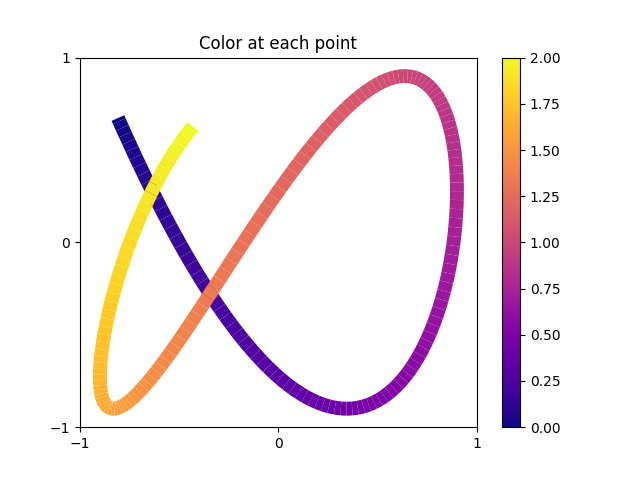
# Some arbitrary function that gives x, y, and color values
t = np.linspace(-7.4, -0.5, 200)
x = 0.9 * np.sin(t)
y = 0.9 * np.cos(1.6 * t)
color = np.linspace(0, 2, t.size)
# Create a figure and plot the line on it
fig1, ax1 = plt.subplots()
lines = colored_line(x, y, color, ax1, linewidth=10, cmap="plasma")
fig1.colorbar(lines) # add a color legend
# Set the axis limits and tick positions
ax1.set_xlim(-1, 1)
ax1.set_ylim(-1, 1)
ax1.set_xticks((-1, 0, 1))
ax1.set_yticks((-1, 0, 1))
ax1.set_title("Color at each point")
plt.show()
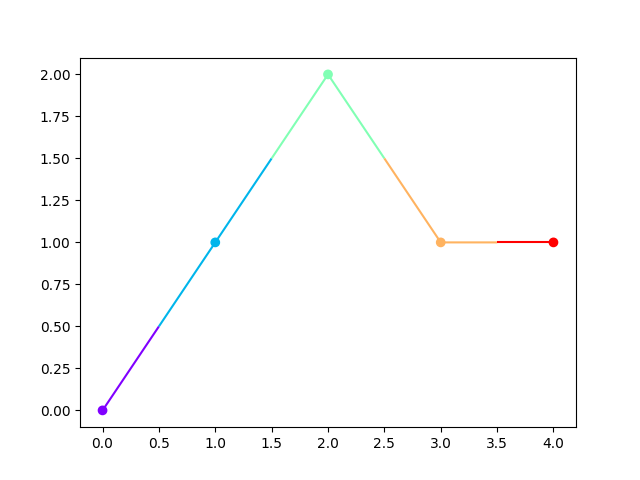
This method is designed to give a smooth impression when distances and color differences between adjacent points are not too large. The following example does not meet this criteria and by that serves to illustrate the segmentation and coloring mechanism.
Color values between points#
def colored_line_between_pts(x, y, c, ax, **lc_kwargs):
"""
Plot a line with a color specified between (x, y) points by a third value.
It does this by creating a collection of line segments between each pair of
neighboring points. The color of each segment is determined by the
made up of two straight lines each connecting the current (x, y) point to the
midpoints of the lines connecting the current point with its two neighbors.
This creates a smooth line with no gaps between the line segments.
Parameters
----------
x, y : array-like
The horizontal and vertical coordinates of the data points.
c : array-like
The color values, which should have a size one less than that of x and y.
ax : Axes
Axis object on which to plot the colored line.
**lc_kwargs
Any additional arguments to pass to matplotlib.collections.LineCollection
constructor. This should not include the array keyword argument because
that is set to the color argument. If provided, it will be overridden.
Returns
-------
matplotlib.collections.LineCollection
The generated line collection representing the colored line.
"""
if "array" in lc_kwargs:
warnings.warn('The provided "array" keyword argument will be overridden')
# Check color array size (LineCollection still works, but values are unused)
if len(c) != len(x) - 1:
warnings.warn(
"The c argument should have a length one less than the length of x and y. "
"If it has the same length, use the colored_line function instead."
)
# Create a set of line segments so that we can color them individually
# This creates the points as an N x 1 x 2 array so that we can stack points
# together easily to get the segments. The segments array for line collection
# needs to be (numlines) x (points per line) x 2 (for x and y)
points = np.array([x, y]).T.reshape(-1, 1, 2)
segments = np.concatenate([points[:-1], points[1:]], axis=1)
lc = LineCollection(segments, **lc_kwargs)
# Set the values used for colormapping
lc.set_array(c)
return ax.add_collection(lc)
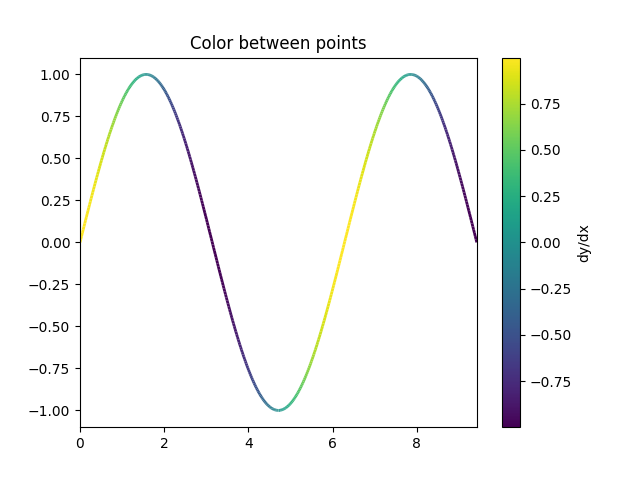
# -------------- Create and show plot --------------
x = np.linspace(0, 3 * np.pi, 500)
y = np.sin(x)
dydx = np.cos(0.5 * (x[:-1] + x[1:])) # first derivative
fig2, ax2 = plt.subplots()
line = colored_line_between_pts(x, y, dydx, ax2, linewidth=2, cmap="viridis")
fig2.colorbar(line, ax=ax2, label="dy/dx")
ax2.set_xlim(x.min(), x.max())
ax2.set_ylim(-1.1, 1.1)
ax2.set_title("Color between points")
plt.show()
Total running time of the script: (0 minutes 1.396 seconds)