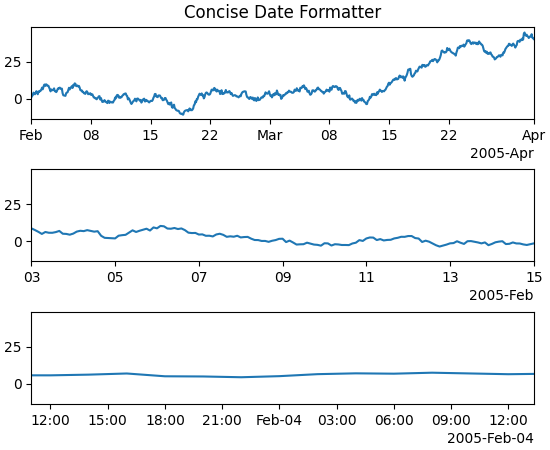
The automatic date formatter used by default can be quite verbose. A new
formatter can be accessed that tries to make the tick labels appropriately
concise.
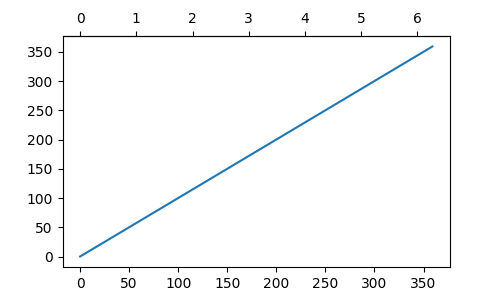
A new FuncScale class was added (and FuncTransform)
to allow the user to have arbitrary scale transformations without having to
write a new subclass of ScaleBase. This can be accessed by:
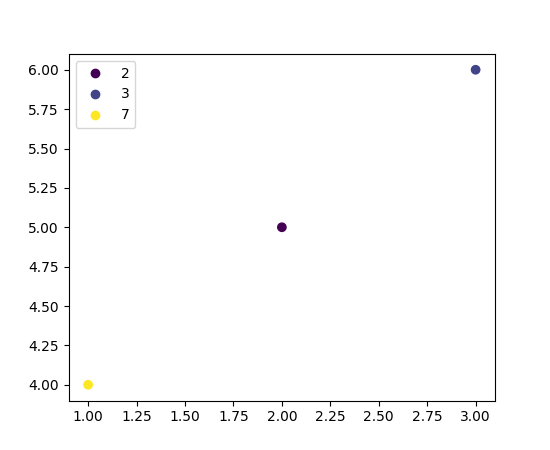
A new method for creating legends for scatter plots has been
introduced. Previously, in order to obtain a legend for a
scatter() plot, one could either plot several
scatters, each with an individual label, or create proxy artists to
show in the legend manually. Now,
PathCollection provides a method
legend_elements() to obtain the
handles and labels for a scatter plot in an automated way. This makes
creating a legend for a scatter plot as easy as
Previous versions of matplotlib required a Framework build of python to
work. The app type was updated to no longer require this, so the MacOSX
backend should work with non-framework python.
This also adds support for the MacOSX backend for PyPy3.
Accessing Figure.frameon (including via get_frameon and set_frameon
now directly forwards to the visibility of the underlying Rectangle artist
(Figure.patch.get_frameon, Figure.patch.set_frameon).
Matplotlib uses Pillow to handle saving to the JPEG and TIFF formats. The
savefig() function gained a pil_kwargs keyword argument, which can
be used to forward arguments to Pillow's PIL.Image.Image.save.
The pil_kwargs argument can also be used when saving to PNG. In that case,
Matplotlib also uses Pillow's PIL.Image.Image.save instead of going through its
own builtin PNG support.
ArtistInspector.get_aliases previously returned the set of aliases as
{fullname:{alias1:None,alias2:None,...}}. The dict-to-None mapping
was used to simulate a set in earlier versions of Python. It has now been
replaced by a set, i.e. {fullname:{alias1,alias2,...}}.
This value is also stored in ArtistInspector.aliasd, which has likewise
changed.
Alternatively to strings like "data" or "axesfraction",
ConnectionPatch now accepts any Transform as input
for the coordsA and coordsB arguments. This allows to draw lines between
points defined in different user defined coordinate systems. Also see the
Connect Simple01 example.
Lines created with the 3d projection in mplot3d can now access the
data using get_data_3d() which returns a
tuple of array_likes containing the (x, y, z) data. The equivalent
set_data_3d can be used to modify the data of
an existing Line3D.
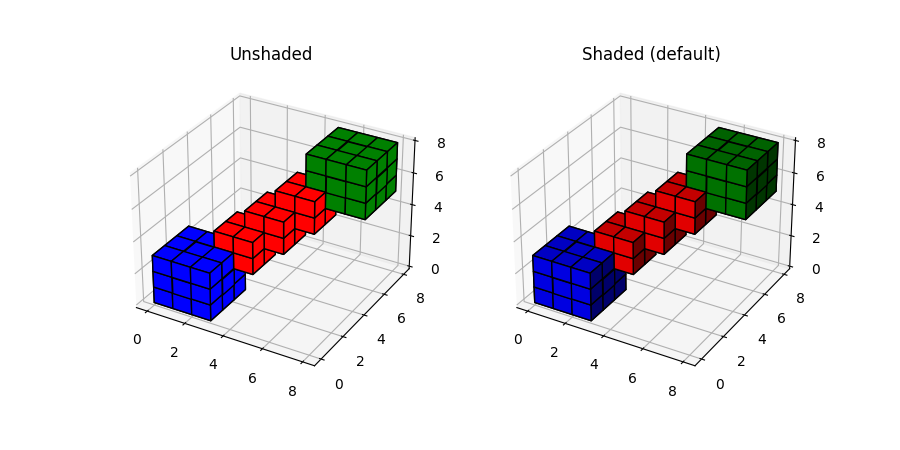
The Axes3D.voxels method now takes a
shade parameter that defaults to True. This shades faces based
on their orientation, behaving just like the matching parameters to
plot_trisurf() and
bar3d(). The plot below shows how
this affects the output.
The Axis.get_inverted and Axis.set_inverted methods query and set whether
the axis uses "inverted" orientation (i.e. increasing to the left for the
x-axis and to the bottom for the y-axis).
If either is True then the numbers will be encapsulated by $
signs. When using TeX this implies that the numbers will be shown
in TeX's math font. When using mathtext, the $ signs around
numbers will ensure Unicode rendering (as implied by mathtext). This
will make sure that the minus signs in the ticks are rendered as the
Unicode minus (U+2212) when using mathtext (without relying on the
fix_minus method).
Figure managers now support a button_press event for mouse
buttons, similar to the key_press events. This allows binding
actions to mouse buttons (see MouseButton) The first application of
this mechanism is support of forward/backward mouse buttons in figures
created with the Qt5 backend.
matplotlib.animation.FuncAnimation has been caching frame data by
default; however, this caching is not ideal in certain cases e.g. When
FuncAnimation needs to be only drawn(not saved) interactively and
memory required by frame data is quite large. By adding
cache_frame_data keyword-only argument, users can now disable this
caching; thereby, this new argument provides a fix for issue
#8528.
We acknowledge that most people want to watch a GIF more than
once. Saving an animation as a GIF with PillowWriter now produces an
endless looping GIF.
The matplotlib.widgets.Slider widget now takes an optional
argument orientation which indicates the direction
('horizontal' or 'vertical') that the slider should take.
When a colorbar is present, its formatter is now used to format the image
values under the mouse cursor in the status bar. For example, for an image
displaying the values 10,000 and 10,001, the statusbar will now (using default
settings) display the values as 10000 and 10001), whereas both values
were previously displayed as 1e+04.
This includes device files; in particular, on Unix systems, one can set
MATPLOTLIBRC to /dev/null to ignore the user's matplotlibrc file and
fall back to Matplotlib's defaults.
As a reminder, if MATPLOTLIBRC points to a directory, Matplotlib will try
to load the matplotlibrc file from $MATPLOTLIBRC/matplotlibrc.
The parsing has been modified to pass the complete line to the LaTeX
system, keeping all commas. Passing a list of strings from within a
Python script still works as it used to.

