Note
Click here to download the full example code
Text properties and layout#
Controlling properties of text and its layout with Matplotlib.
matplotlib.text.Text instances have a variety of properties which can be
configured via keyword arguments to set_title, set_xlabel,
text, etc.
Property |
Value Type |
|---|---|
alpha |
|
backgroundcolor |
any matplotlib color |
bbox |
|
clip_box |
a matplotlib.transform.Bbox instance |
clip_on |
bool |
clip_path |
|
color |
any matplotlib color |
family |
[ |
fontproperties |
|
horizontalalignment or ha |
[ |
label |
any string |
linespacing |
|
multialignment |
[ |
name or fontname |
string e.g., [ |
picker |
[None|float|bool|callable] |
position |
(x, y) |
rotation |
[ angle in degrees | |
size or fontsize |
[ size in points | relative size, e.g., |
style or fontstyle |
[ |
text |
string or anything printable with '%s' conversion |
transform |
|
variant |
[ |
verticalalignment or va |
[ |
visible |
bool |
weight or fontweight |
[ |
x |
|
y |
|
zorder |
any number |
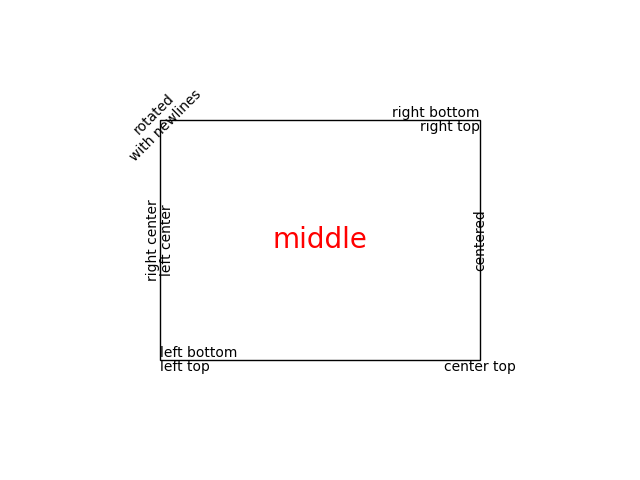
You can lay out text with the alignment arguments
horizontalalignment, verticalalignment, and
multialignment. horizontalalignment controls whether the x
positional argument for the text indicates the left, center or right
side of the text bounding box. verticalalignment controls whether
the y positional argument for the text indicates the bottom, center or
top side of the text bounding box. multialignment, for newline
separated strings only, controls whether the different lines are left,
center or right justified. Here is an example which uses the
text() command to show the various alignment
possibilities. The use of transform=ax.transAxes throughout the
code indicates that the coordinates are given relative to the axes
bounding box, with (0, 0) being the lower left of the axes and (1, 1) the
upper right.
import matplotlib.pyplot as plt
import matplotlib.patches as patches

# build a rectangle in axes coords
left, width = .25, .5
bottom, height = .25, .5
right = left + width
top = bottom + height

fig = plt.figure()
ax = fig.add_axes([0, 0, 1, 1])

# axes coordinates: (0, 0) is bottom left and (1, 1) is upper right
p = patches.Rectangle(
    (left, bottom), width, height,
    fill=False, transform=ax.transAxes, clip_on=False
    )

ax.add_patch(p)

ax.text(left, bottom, 'left top',
        horizontalalignment='left',
        verticalalignment='top',
        transform=ax.transAxes)

ax.text(left, bottom, 'left bottom',
        horizontalalignment='left',
        verticalalignment='bottom',
        transform=ax.transAxes)

ax.text(right, top, 'right bottom',
        horizontalalignment='right',
        verticalalignment='bottom',
        transform=ax.transAxes)

ax.text(right, top, 'right top',
        horizontalalignment='right',
        verticalalignment='top',
        transform=ax.transAxes)

ax.text(right, bottom, 'center top',
        horizontalalignment='center',
        verticalalignment='top',
        transform=ax.transAxes)

ax.text(left, 0.5*(bottom+top), 'right center',
        horizontalalignment='right',
        verticalalignment='center',
        rotation='vertical',
        transform=ax.transAxes)

ax.text(left, 0.5*(bottom+top), 'left center',
        horizontalalignment='left',
        verticalalignment='center',
        rotation='vertical',
        transform=ax.transAxes)

ax.text(0.5*(left+right), 0.5*(bottom+top), 'middle',
        horizontalalignment='center',
        verticalalignment='center',
        fontsize=20, color='red',
        transform=ax.transAxes)

ax.text(right, 0.5*(bottom+top), 'centered',
        horizontalalignment='center',
        verticalalignment='center',
        rotation='vertical',
        transform=ax.transAxes)

ax.text(left, top, 'rotated\nwith newlines',
        horizontalalignment='center',
        verticalalignment='center',
        rotation=45,
        transform=ax.transAxes)

ax.set_axis_off()
plt.show()
Default Font#
The base default font is controlled by a set of rcParams. To set the font
for mathematical expressions, use the rcParams beginning with mathtext
(see mathtext).
rcParam |
usage |
|---|---|
|
List of font families (installed on user's machine)
and/or |
|
The default style, ex |
|
Default variant, ex |
|
Default stretch, ex |
|
Default weight. Either string or integer |
|
Default font size in points. Relative font sizes
( |
Matplotlib can use font families installed on the user's computer, i.e.
Helvetica, Times, etc. Font families can also be specified with
generic-family aliases like ({'cursive', 'fantasy', 'monospace',
'sans', 'sans serif', 'sans-serif', 'serif'}).
Note
To access the full list of available fonts:
matplotlib.font_manager.get_font_names()
The mapping between the generic family aliases and actual font families (mentioned at default rcParams) is controlled by the following rcParams:
CSS-based generic-family alias |
rcParam with mappings |
|---|---|
|
|
|
|
|
|
|
|
|
|
If any of generic family names appear in 'font.family', we replace that entry
by all the entries in the corresponding rcParam mapping.
For example:
matplotlib.rcParams['font.family'] = ['Family1', 'serif', 'Family2']
matplotlib.rcParams['font.serif'] = ['SerifFamily1', 'SerifFamily2']

# This is effectively translated to:
matplotlib.rcParams['font.family'] = ['Family1', 'SerifFamily1', 'SerifFamily2', 'Family2']
Text with non-latin glyphs#
As of v2.0 the default font, DejaVu, contains glyphs for many western alphabets, but not other scripts, such as Chinese, Korean, or Japanese.
To set the default font to be one that supports the code points you
need, prepend the font name to 'font.family' (recommended), or to the
desired alias lists.
# first method
matplotlib.rcParams['font.family'] = ['Source Han Sans TW', 'sans-serif']

# second method
matplotlib.rcParams['font.family'] = ['sans-serif']
matplotlib.rcParams['sans-serif'] = ['Source Han Sans TW', ...]
The generic family alias lists contain fonts that are either shipped alongside Matplotlib (so they have 100% chance of being found), or fonts which have a very high probability of being present in most systems.
A good practice when setting custom font families is to append a generic-family to the font-family list as a last resort.
You can also set it in your .matplotlibrc file:
font.family: Source Han Sans TW, Arial, sans-serif
To control the font used on per-artist basis use the name, fontname or fontproperties keyword arguments documented above.
On linux, fc-list can be a useful tool to discover the font name; for example
$ fc-list :lang=zh family
Noto to Sans Mono CJK TC,Noto Sans Mono CJK TC Bold
Noto Sans CJK TC,Noto Sans CJK TC Medium
Noto Sans CJK TC,Noto Sans CJK TC DemiLight
Noto Sans CJK KR,Noto Sans CJK KR Black
Noto Sans CJK TC,Noto Sans CJK TC Black
Noto Sans Mono CJK TC,Noto Sans Mono CJK TC Regular
Noto Sans CJK SC,Noto Sans CJK SC Light
lists all of the fonts that support Chinese.