Note
Click here to download the full example code
Customized Colorbars Tutorial#
This tutorial shows how to build and customize standalone colorbars, i.e. without an attached plot.
Customized Colorbars#
A colorbar needs a "mappable" (matplotlib.cm.ScalarMappable)
object (typically, an image) which indicates the colormap and the norm to be
used. In order to create a colorbar without an attached image, one can instead
use a ScalarMappable with no associated data.
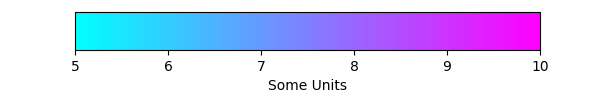
Basic continuous colorbar#
Here we create a basic continuous colorbar with ticks and labels.
The arguments to the colorbar call are the ScalarMappable
(constructed using the norm and cmap arguments), the axes where the
colorbar should be drawn, and the colorbar's orientation.
For more information see the colorbar API.
import matplotlib.pyplot as plt
import matplotlib as mpl

fig, ax = plt.subplots(figsize=(6, 1))
fig.subplots_adjust(bottom=0.5)

cmap = mpl.cm.cool
norm = mpl.colors.Normalize(vmin=5, vmax=10)

fig.colorbar(mpl.cm.ScalarMappable(norm=norm, cmap=cmap),
             cax=ax, orientation='horizontal', label='Some Units')
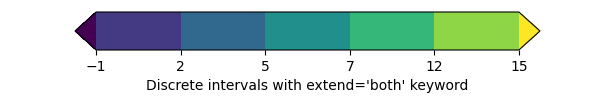
Extended colorbar with continuous colorscale#
The second example shows how to make a discrete colorbar based on a continuous cmap. With the "extend" keyword argument the appropriate colors are chosen to fill the colorspace, including the extensions:
fig, ax = plt.subplots(figsize=(6, 1))
fig.subplots_adjust(bottom=0.5)

cmap = mpl.cm.viridis
bounds = [-1, 2, 5, 7, 12, 15]
norm = mpl.colors.BoundaryNorm(bounds, cmap.N, extend='both')

fig.colorbar(mpl.cm.ScalarMappable(norm=norm, cmap=cmap),
             cax=ax, orientation='horizontal',
             label="Discrete intervals with extend='both' keyword")
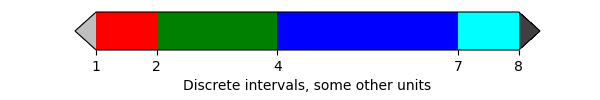
Discrete intervals colorbar#
The third example illustrates the use of a
ListedColormap which generates a colormap from a
set of listed colors, colors.BoundaryNorm which generates a colormap
index based on discrete intervals and extended ends to show the "over" and
"under" value colors. Over and under are used to display data outside of the
normalized [0, 1] range. Here we pass colors as gray shades as a string
encoding a float in the 0-1 range.
If a ListedColormap is used, the length of the
bounds array must be one greater than the length of the color list. The
bounds must be monotonically increasing.
This time we pass additional arguments to
colorbar. For the out-of-range values to display on the colorbar
without using the extend keyword with
colors.BoundaryNorm, we have to use the extend keyword argument directly
in the colorbar call. Here we also
use the spacing argument to make
the length of each colorbar segment proportional to its corresponding
interval.
fig, ax = plt.subplots(figsize=(6, 1))
fig.subplots_adjust(bottom=0.5)

cmap = (mpl.colors.ListedColormap(['red', 'green', 'blue', 'cyan'])
        .with_extremes(over='0.25', under='0.75'))

bounds = [1, 2, 4, 7, 8]
norm = mpl.colors.BoundaryNorm(bounds, cmap.N)
fig.colorbar(
    mpl.cm.ScalarMappable(cmap=cmap, norm=norm),
    cax=ax,
    extend='both',
    ticks=bounds,
    spacing='proportional',
    orientation='horizontal',
    label='Discrete intervals, some other units',
)
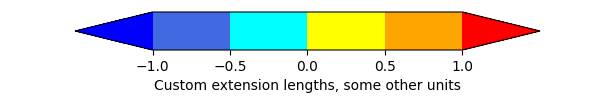
Colorbar with custom extension lengths#
Here we illustrate the use of custom length colorbar extensions, on a
colorbar with discrete intervals. To make the length of each extension the
same as the length of the interior colors, use extendfrac='auto'.
fig, ax = plt.subplots(figsize=(6, 1))
fig.subplots_adjust(bottom=0.5)

cmap = (mpl.colors.ListedColormap(['royalblue', 'cyan', 'yellow', 'orange'])
        .with_extremes(over='red', under='blue'))

bounds = [-1.0, -0.5, 0.0, 0.5, 1.0]
norm = mpl.colors.BoundaryNorm(bounds, cmap.N)
fig.colorbar(
    mpl.cm.ScalarMappable(cmap=cmap, norm=norm),
    cax=ax,
    extend='both',
    extendfrac='auto',
    ticks=bounds,
    spacing='uniform',
    orientation='horizontal',
    label='Custom extension lengths, some other units',
)

plt.show()