Ctrl+K
Logo image Logo image
  • Plot types
  • Examples
  • Tutorials
  • Reference
  • User guide
  • Develop
  • Release notes
  • Plot types
  • Examples
  • Tutorials
  • Reference
  • User guide
  • Develop
  • Release notes

Section Navigation

  • Basic
    • plot(x, y)
    • scatter(x, y)
    • bar(x, height)
    • stem(x, y)
    • step(x, y)
    • fill_between(x, y1, y2)
    • stackplot(x, y)
  • Plots of arrays and fields
    • imshow(Z)
    • pcolormesh(X, Y, Z)
    • contour(X, Y, Z)
    • contourf(X, Y, Z)
    • barbs(X, Y, U, V)
    • quiver(X, Y, U, V)
    • streamplot(X, Y, U, V)
  • Statistics plots
    • hist(x)
    • boxplot(X)
    • errorbar(x, y, yerr, xerr)
    • violinplot(D)
    • eventplot(D)
    • hist2d(x, y)
    • hexbin(x, y, C)
    • pie(x)
  • Unstructured coordinates
    • tricontour(x, y, z)
    • tricontourf(x, y, z)
    • tripcolor(x, y, z)
    • triplot(x, y)

Note

Click here to download the full example code
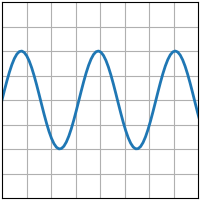
plot(x, y)#

See plot.

plot
import matplotlib.pyplot as plt
import numpy as np

plt.style.use('_mpl-gallery')

# make data
x = np.linspace(0, 10, 100)
y = 4 + 2 * np.sin(2 * x)

# plot
fig, ax = plt.subplots()

ax.plot(x, y, linewidth=2.0)

ax.set(xlim=(0, 8), xticks=np.arange(1, 8),
       ylim=(0, 8), yticks=np.arange(1, 8))

plt.show()

Download Python source code: plot.py

Download Jupyter notebook: plot.ipynb

Gallery generated by Sphinx-Gallery

You are reading an old version of the documentation (v3.6.1). For the latest version see https://matplotlib.org/stable/plot_types/basic/plot.html

© Copyright 2002–2012 John Hunter, Darren Dale, Eric Firing, Michael Droettboom and the Matplotlib development team; 2012–2022 The Matplotlib development team.

Created using Sphinx 5.1.1.