Ctrl+K
Logo image Logo image
  • Plot types
  • Examples
  • Tutorials
  • Reference
  • User guide
  • Develop
  • Release notes
  • Plot types
  • Examples
  • Tutorials
  • Reference
  • User guide
  • Develop
  • Release notes

Section Navigation

  • Basic
    • plot(x, y)
    • scatter(x, y)
    • bar(x, height)
    • stem(x, y)
    • step(x, y)
    • fill_between(x, y1, y2)
    • stackplot(x, y)
  • Plots of arrays and fields
    • imshow(Z)
    • pcolormesh(X, Y, Z)
    • contour(X, Y, Z)
    • contourf(X, Y, Z)
    • barbs(X, Y, U, V)
    • quiver(X, Y, U, V)
    • streamplot(X, Y, U, V)
  • Statistics plots
    • hist(x)
    • boxplot(X)
    • errorbar(x, y, yerr, xerr)
    • violinplot(D)
    • eventplot(D)
    • hist2d(x, y)
    • hexbin(x, y, C)
    • pie(x)
  • Unstructured coordinates
    • tricontour(x, y, z)
    • tricontourf(x, y, z)
    • tripcolor(x, y, z)
    • triplot(x, y)

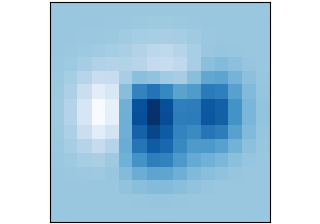
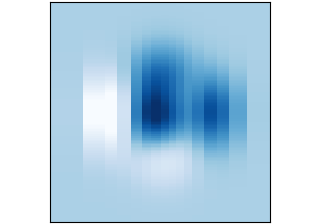
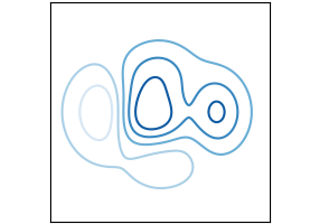
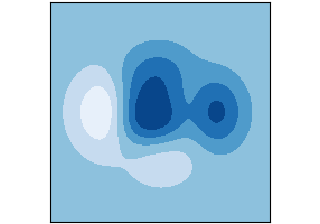
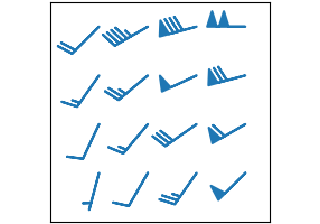
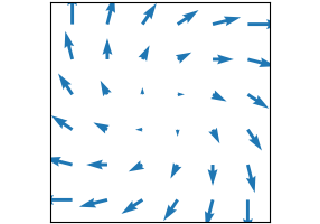
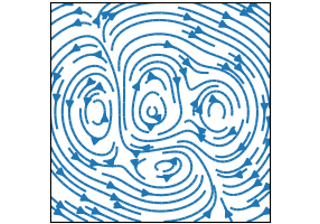
Plots of arrays and fields#

Plotting for arrays of data Z(x, y) and fields U(x, y), V(x, y).

imshow(Z)

imshow(Z)

imshow(Z)
pcolormesh(X, Y, Z)

pcolormesh(X, Y, Z)

pcolormesh(X, Y, Z)
contour(X, Y, Z)

contour(X, Y, Z)

contour(X, Y, Z)
contourf(X, Y, Z)

contourf(X, Y, Z)

contourf(X, Y, Z)
barbs(X, Y, U, V)

barbs(X, Y, U, V)

barbs(X, Y, U, V)
quiver(X, Y, U, V)

quiver(X, Y, U, V)

quiver(X, Y, U, V)
streamplot(X, Y, U, V)

streamplot(X, Y, U, V)

streamplot(X, Y, U, V)
You are reading an old version of the documentation (v3.6.1). For the latest version see https://matplotlib.org/stable/plot_types/arrays/index.html

© Copyright 2002–2012 John Hunter, Darren Dale, Eric Firing, Michael Droettboom and the Matplotlib development team; 2012–2022 The Matplotlib development team.

Created using Sphinx 5.1.1.