Note
Click here to download the full example code
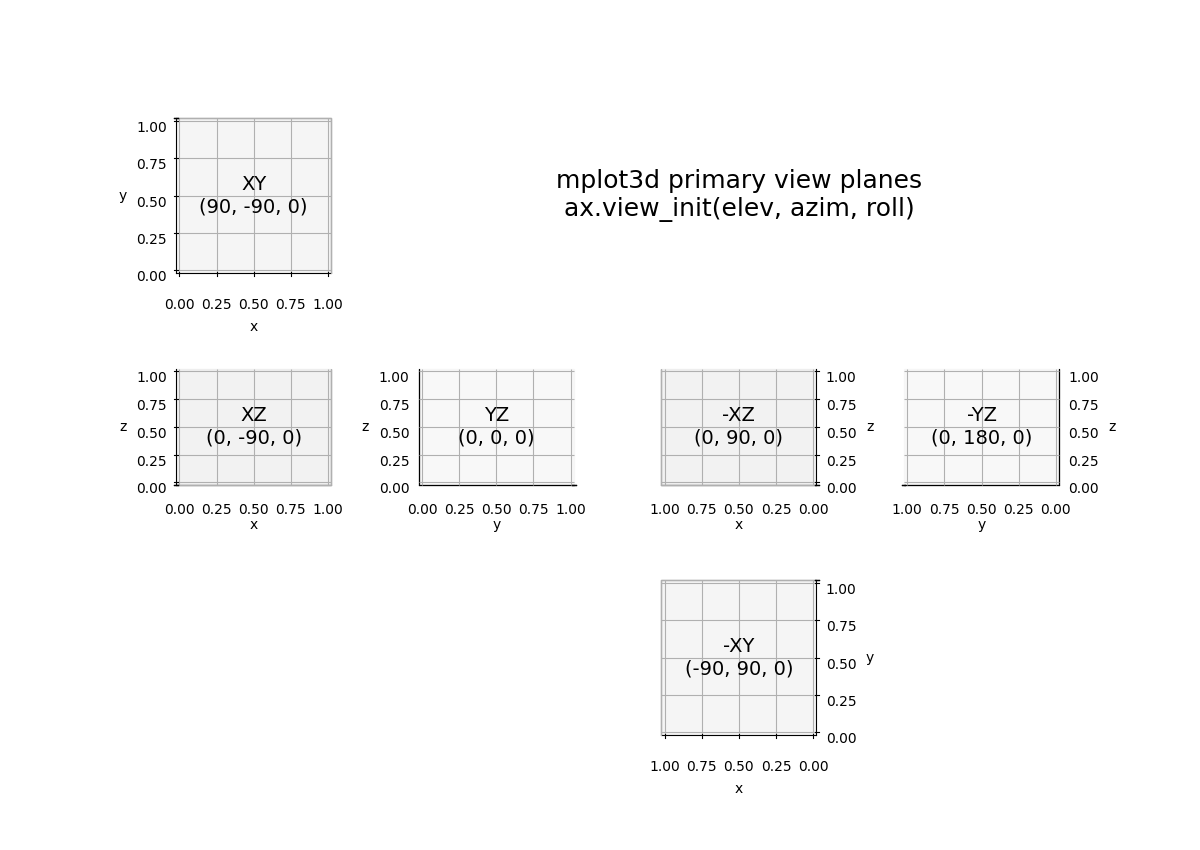
Primary 3D view planes#
This example generates an "unfolded" 3D plot that shows each of the primary 3D view planes. The elevation, azimuth, and roll angles required for each view are labeled. You could print out this image and fold it into a box where each plane forms a side of the box.
import matplotlib.pyplot as plt


def annotate_axes(ax, text, fontsize=18):
    ax.text(x=0.5, y=0.5, z=0.5, s=text,
            va="center", ha="center", fontsize=fontsize, color="black")

# (plane, (elev, azim, roll))
views = [('XY',   (90, -90, 0)),
         ('XZ',    (0, -90, 0)),
         ('YZ',    (0,   0, 0)),
         ('-XY', (-90,  90, 0)),
         ('-XZ',   (0,  90, 0)),
         ('-YZ',   (0, 180, 0))]

layout = [['XY',  '.',   'L',   '.'],
          ['XZ', 'YZ', '-XZ', '-YZ'],
          ['.',   '.', '-XY',   '.']]
fig, axd = plt.subplot_mosaic(layout, subplot_kw={'projection': '3d'},
                              figsize=(12, 8.5))
for plane, angles in views:
    axd[plane].set_xlabel('x')
    axd[plane].set_ylabel('y')
    axd[plane].set_zlabel('z')
    axd[plane].set_proj_type('ortho')
    axd[plane].view_init(elev=angles[0], azim=angles[1], roll=angles[2])
    axd[plane].set_box_aspect(None, zoom=1.25)

    label = f'{plane}\n{angles}'
    annotate_axes(axd[plane], label, fontsize=14)

for plane in ('XY', '-XY'):
    axd[plane].set_zticklabels([])
    axd[plane].set_zlabel('')
for plane in ('XZ', '-XZ'):
    axd[plane].set_yticklabels([])
    axd[plane].set_ylabel('')
for plane in ('YZ', '-YZ'):
    axd[plane].set_xticklabels([])
    axd[plane].set_xlabel('')

label = 'mplot3d primary view planes\n' + 'ax.view_init(elev, azim, roll)'
annotate_axes(axd['L'], label, fontsize=18)
axd['L'].set_axis_off()

plt.show()