matplotlib.axes.Axes.legend#
- Axes.legend(*args, **kwargs)[source]#
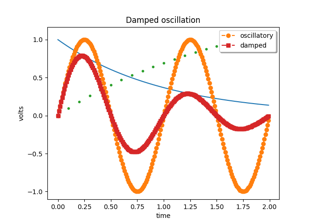
Place a legend on the Axes.
Call signatures:
legend()
legend(handles, labels)
legend(handles=handles)
legend(labels)
The call signatures correspond to the following different ways to use this method:
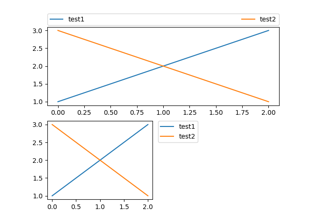
1. Automatic detection of elements to be shown in the legend
The elements to be added to the legend are automatically determined, when you do not pass in any extra arguments.
In this case, the labels are taken from the artist. You can specify them either at artist creation or by calling the
set_label()method on the artist:ax.plot([1, 2, 3], label='Inline label') ax.legend()
or:
line, = ax.plot([1, 2, 3])
line.set_label('Label via method')
ax.legend()
Note
Specific artists can be excluded from the automatic legend element selection by using a label starting with an underscore, "_". A string starting with an underscore is the default label for all artists, so calling
Axes.legendwithout any arguments and without setting the labels manually will result in no legend being drawn.2. Explicitly listing the artists and labels in the legend
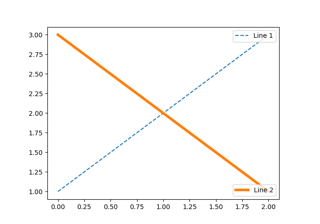
For full control of which artists have a legend entry, it is possible to pass an iterable of legend artists followed by an iterable of legend labels respectively:
ax.legend([line1, line2, line3], ['label1', 'label2', 'label3'])
3. Explicitly listing the artists in the legend
This is similar to 2, but the labels are taken from the artists' label properties. Example:
line1, = ax.plot([1, 2, 3], label='label1')
line2, = ax.plot([1, 2, 3], label='label2')
ax.legend(handles=[line1, line2])
4. Labeling existing plot elements
Discouraged
This call signature is discouraged, because the relation between plot elements and labels is only implicit by their order and can easily be mixed up.
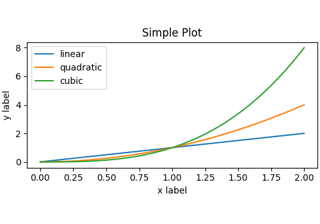
To make a legend for all artists on an Axes, call this function with an iterable of strings, one for each legend item. For example:
ax.plot([1, 2, 3])
ax.plot([5, 6, 7])
ax.legend(['First line', 'Second line'])
- Parameters:
- handlessequence of
Artist, optional A list of Artists (lines, patches) to be added to the legend. Use this together with labels, if you need full control on what is shown in the legend and the automatic mechanism described above is not sufficient.
The length of handles and labels should be the same in this case. If they are not, they are truncated to the smaller length.
- labelslist of str, optional
A list of labels to show next to the artists. Use this together with handles, if you need full control on what is shown in the legend and the automatic mechanism described above is not sufficient.
- handlessequence of
- Returns:
- Other Parameters:
- locstr or pair of floats, default:
rcParams["legend.loc"](default:'best') ('best' for axes, 'upper right' for figures) The location of the legend.
The strings
'upper left', 'upper right', 'lower left', 'lower right'place the legend at the corresponding corner of the axes/figure.The strings
'upper center', 'lower center', 'center left', 'center right'place the legend at the center of the corresponding edge of the axes/figure.The string
'center'places the legend at the center of the axes/figure.The string
'best'places the legend at the location, among the nine locations defined so far, with the minimum overlap with other drawn artists. This option can be quite slow for plots with large amounts of data; your plotting speed may benefit from providing a specific location.The location can also be a 2-tuple giving the coordinates of the lower-left corner of the legend in axes coordinates (in which case bbox_to_anchor will be ignored).
For back-compatibility,
'center right'(but no other location) can also be spelled'right', and each "string" locations can also be given as a numeric value:Location String
Location Code
'best'
0
'upper right'
1
'upper left'
2
'lower left'
3
'lower right'
4
'right'
5
'center left'
6
'center right'
7
'lower center'
8
'upper center'
9
'center'
10
- bbox_to_anchor
BboxBase, 2-tuple, or 4-tuple of floats Box that is used to position the legend in conjunction with loc. Defaults to
axes.bbox(if called as a method toAxes.legend) orfigure.bbox(ifFigure.legend). This argument allows arbitrary placement of the legend.Bbox coordinates are interpreted in the coordinate system given by bbox_transform, with the default transform Axes or Figure coordinates, depending on which
legendis called.If a 4-tuple or
BboxBaseis given, then it specifies the bbox(x, y, width, height)that the legend is placed in. To put the legend in the best location in the bottom right quadrant of the axes (or figure):loc='best', bbox_to_anchor=(0.5, 0., 0.5, 0.5)
A 2-tuple
(x, y)places the corner of the legend specified by loc at x, y. For example, to put the legend's upper right-hand corner in the center of the axes (or figure) the following keywords can be used:loc='upper right', bbox_to_anchor=(0.5, 0.5)
- ncolsint, default: 1
The number of columns that the legend has.
For backward compatibility, the spelling ncol is also supported but it is discouraged. If both are given, ncols takes precedence.
- propNone or
matplotlib.font_manager.FontPropertiesor dict The font properties of the legend. If None (default), the current
matplotlib.rcParamswill be used.- fontsizeint or {'xx-small', 'x-small', 'small', 'medium', 'large', 'x-large', 'xx-large'}
The font size of the legend. If the value is numeric the size will be the absolute font size in points. String values are relative to the current default font size. This argument is only used if prop is not specified.
- labelcolorstr or list, default:
rcParams["legend.labelcolor"](default:'None') The color of the text in the legend. Either a valid color string (for example, 'red'), or a list of color strings. The labelcolor can also be made to match the color of the line or marker using 'linecolor', 'markerfacecolor' (or 'mfc'), or 'markeredgecolor' (or 'mec').
Labelcolor can be set globally using
rcParams["legend.labelcolor"](default:'None'). If None, usercParams["text.color"](default:'black').- numpointsint, default:
rcParams["legend.numpoints"](default:1) The number of marker points in the legend when creating a legend entry for a
Line2D(line).- scatterpointsint, default:
rcParams["legend.scatterpoints"](default:1) The number of marker points in the legend when creating a legend entry for a
PathCollection(scatter plot).- scatteryoffsetsiterable of floats, default:
[0.375, 0.5, 0.3125] The vertical offset (relative to the font size) for the markers created for a scatter plot legend entry. 0.0 is at the base the legend text, and 1.0 is at the top. To draw all markers at the same height, set to
[0.5].- markerscalefloat, default:
rcParams["legend.markerscale"](default:1.0) The relative size of legend markers compared with the originally drawn ones.
- markerfirstbool, default: True
If True, legend marker is placed to the left of the legend label. If False, legend marker is placed to the right of the legend label.
- frameonbool, default:
rcParams["legend.frameon"](default:True) Whether the legend should be drawn on a patch (frame).
- fancyboxbool, default:
rcParams["legend.fancybox"](default:True) Whether round edges should be enabled around the
FancyBboxPatchwhich makes up the legend's background.- shadowbool, default:
rcParams["legend.shadow"](default:False) Whether to draw a shadow behind the legend.
- framealphafloat, default:
rcParams["legend.framealpha"](default:0.8) The alpha transparency of the legend's background. If shadow is activated and framealpha is
None, the default value is ignored.- facecolor"inherit" or color, default:
rcParams["legend.facecolor"](default:'inherit') The legend's background color. If
"inherit", usercParams["axes.facecolor"](default:'white').- edgecolor"inherit" or color, default:
rcParams["legend.edgecolor"](default:'0.8') The legend's background patch edge color. If
"inherit", use takercParams["axes.edgecolor"](default:'black').- mode{"expand", None}
If mode is set to
"expand"the legend will be horizontally expanded to fill the axes area (or bbox_to_anchor if defines the legend's size).- bbox_transformNone or
matplotlib.transforms.Transform The transform for the bounding box (bbox_to_anchor). For a value of
None(default) the Axes'transAxestransform will be used.- titlestr or None
The legend's title. Default is no title (
None).- title_fontpropertiesNone or
matplotlib.font_manager.FontPropertiesor dict The font properties of the legend's title. If None (default), the title_fontsize argument will be used if present; if title_fontsize is also None, the current
rcParams["legend.title_fontsize"](default:None) will be used.- title_fontsizeint or {'xx-small', 'x-small', 'small', 'medium', 'large', 'x-large', 'xx-large'}, default:
rcParams["legend.title_fontsize"](default:None) The font size of the legend's title. Note: This cannot be combined with title_fontproperties. If you want to set the fontsize alongside other font properties, use the size parameter in title_fontproperties.
- alignment{'center', 'left', 'right'}, default: 'center'
The alignment of the legend title and the box of entries. The entries are aligned as a single block, so that markers always lined up.
- borderpadfloat, default:
rcParams["legend.borderpad"](default:0.4) The fractional whitespace inside the legend border, in font-size units.
- labelspacingfloat, default:
rcParams["legend.labelspacing"](default:0.5) The vertical space between the legend entries, in font-size units.
- handlelengthfloat, default:
rcParams["legend.handlelength"](default:2.0) The length of the legend handles, in font-size units.
- handleheightfloat, default:
rcParams["legend.handleheight"](default:0.7) The height of the legend handles, in font-size units.
- handletextpadfloat, default:
rcParams["legend.handletextpad"](default:0.8) The pad between the legend handle and text, in font-size units.
- borderaxespadfloat, default:
rcParams["legend.borderaxespad"](default:0.5) The pad between the axes and legend border, in font-size units.
- columnspacingfloat, default:
rcParams["legend.columnspacing"](default:2.0) The spacing between columns, in font-size units.
- handler_mapdict or None
The custom dictionary mapping instances or types to a legend handler. This handler_map updates the default handler map found at
matplotlib.legend.Legend.get_legend_handler_map.
- locstr or pair of floats, default:
See also
Notes
Some artists are not supported by this function. See Legend guide for details.
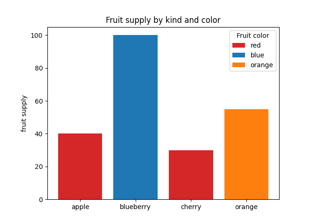
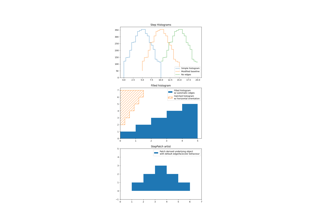
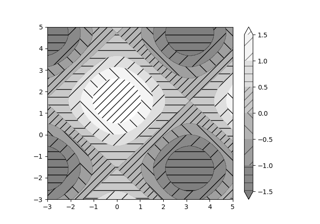
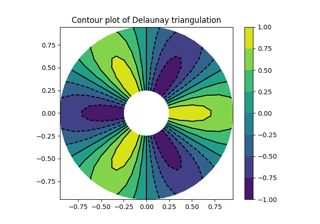
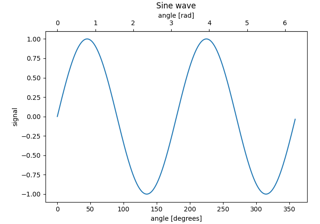
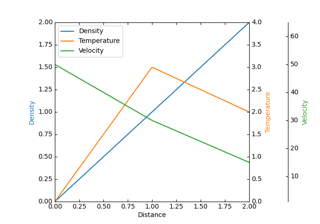
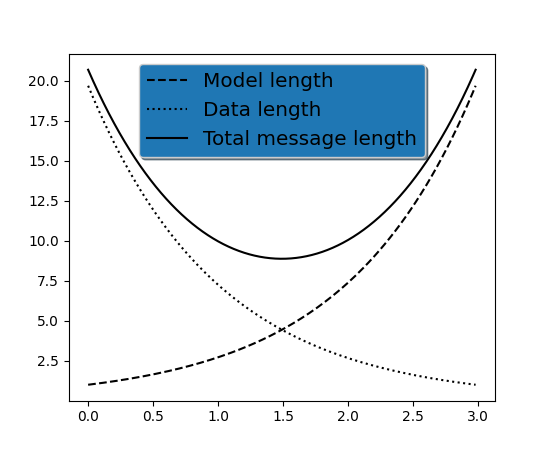
Examples
(Source code, png)

Examples using matplotlib.axes.Axes.legend#
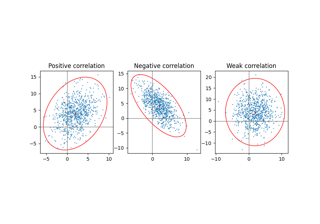
Plot a confidence ellipse of a two-dimensional dataset
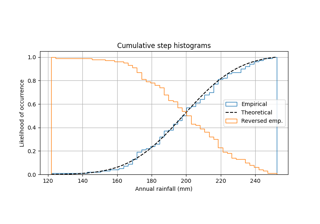
Using histograms to plot a cumulative distribution
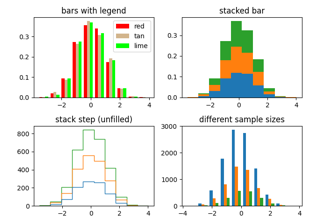
The histogram (hist) function with multiple data sets