Note
Click here to download the full example code
Text rendering with LaTeX#
Matplotlib can use LaTeX to render text. This is activated by setting
text.usetex : True in your rcParams, or by setting the usetex property
to True on individual Text objects. Text handling through LaTeX is slower
than Matplotlib's very capable mathtext, but
is more flexible, since different LaTeX packages (font packages, math packages,
etc.) can be used. The results can be striking, especially when you take care
to use the same fonts in your figures as in the main document.
Matplotlib's LaTeX support requires a working LaTeX installation. For
the *Agg backends, dvipng is additionally required; for the PS backend,
PSfrag, dvips and Ghostscript are additionally required. For the PDF
and SVG backends, if LuaTeX is present, it will be used to speed up some
post-processing steps, but note that it is not used to parse the TeX string
itself (only LaTeX is supported). The executables for these external
dependencies must all be located on your PATH.
There are a couple of options to mention, which can be changed using rc settings. Here is an example matplotlibrc file:
font.family        : serif
font.serif         : Times, Palatino, New Century Schoolbook, Bookman, Computer Modern Roman
font.sans-serif    : Helvetica, Avant Garde, Computer Modern Sans Serif
font.cursive       : Zapf Chancery
font.monospace     : Courier, Computer Modern Typewriter

text.usetex        : true
The first valid font in each family is the one that will be loaded. If the fonts are not specified, the Computer Modern fonts are used by default. All of the other fonts are Adobe fonts. Times and Palatino each have their own accompanying math fonts, while the other Adobe serif fonts make use of the Computer Modern math fonts. See the PSNFSS documentation for more details.
To use LaTeX and select Helvetica as the default font, without editing matplotlibrc use:
import matplotlib.pyplot as plt
plt.rcParams.update({
    "text.usetex": True,
    "font.family": "sans-serif",
    "font.sans-serif": ["Helvetica"]})
# for Palatino and other serif fonts use:
plt.rcParams.update({
    "text.usetex": True,
    "font.family": "serif",
    "font.serif": ["Palatino"],
})
# It's also possible to use the reduced notation by directly setting font.family:
plt.rcParams.update({
  "text.usetex": True,
  "font.family": "Helvetica"
})
Currently, the supported fonts are:
family |
fonts |
|---|---|
|
|
|
|
|
|
|
|
Here is the standard example, Rendering math equations using TeX:
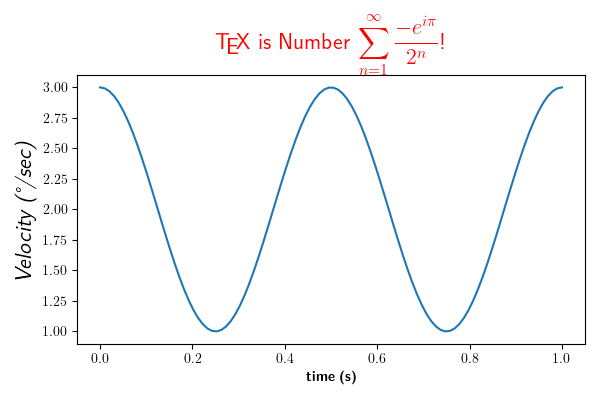
Note that display math mode ($$ e=mc^2 $$) is not supported, but adding the
command \displaystyle, as in the above demo, will produce the same results.
Non-ASCII characters (e.g. the degree sign in the y-label above) are supported to the extent that they are supported by inputenc.
Note
Certain characters require special escaping in TeX, such as:
# $ % & ~ _ ^ \ { } \( \) \[ \]
Therefore, these characters will behave differently depending on
rcParams["text.usetex"] (default: False).
PostScript options#
In order to produce encapsulated PostScript (EPS) files that can be embedded
in a new LaTeX document, the default behavior of Matplotlib is to distill the
output, which removes some PostScript operators used by LaTeX that are illegal
in an EPS file. This step produces results which may be unacceptable to some
users, because the text is coarsely rasterized and converted to bitmaps, which
are not scalable like standard PostScript, and the text is not searchable. One
workaround is to set rcParams["ps.distiller.res"] (default: 6000) to a higher value (perhaps 6000)
in your rc settings, which will produce larger files but may look better and
scale reasonably. A better workaround, which requires Poppler or Xpdf, can
be activated by changing rcParams["ps.usedistiller"] (default: None) to xpdf. This alternative
produces PostScript without rasterizing text, so it scales properly, can be
edited in Adobe Illustrator, and searched text in pdf documents.
Possible hangups#
On Windows, the
PATHenvironment variable may need to be modified to include the directories containing the latex, dvipng and ghostscript executables. See Environment variables and Setting environment variables in Windows for details.Using MiKTeX with Computer Modern fonts, if you get odd *Agg and PNG results, go to MiKTeX/Options and update your format files
On Ubuntu and Gentoo, the base texlive install does not ship with the type1cm package. You may need to install some of the extra packages to get all the goodies that come bundled with other LaTeX distributions.
Some progress has been made so Matplotlib uses the dvi files directly for text layout. This allows LaTeX to be used for text layout with the pdf and svg backends, as well as the *Agg and PS backends. In the future, a LaTeX installation may be the only external dependency.
Troubleshooting#
Try deleting your
.matplotlib/tex.cachedirectory. If you don't know where to find.matplotlib, see matplotlib configuration and cache directory locations.Make sure LaTeX, dvipng and ghostscript are each working and on your
PATH.Make sure what you are trying to do is possible in a LaTeX document, that your LaTeX syntax is valid and that you are using raw strings if necessary to avoid unintended escape sequences.
rcParams["text.latex.preamble"](default:'') is not officially supported. This option provides lots of flexibility, and lots of ways to cause problems. Please disable this option before reporting problems to the mailing list.If you still need help, please see Getting help.
Keywords: matplotlib code example, codex, python plot, pyplot Gallery generated by Sphinx-Gallery