Note
Click here to download the full example code
Legend guide#
Generating legends flexibly in Matplotlib.
This legend guide is an extension of the documentation available at
legend() - please ensure you are familiar with
contents of that documentation before proceeding with this guide.
This guide makes use of some common terms, which are documented here for clarity:
- legend entry#
A legend is made up of one or more legend entries. An entry is made up of exactly one key and one label.
- legend key#
The colored/patterned marker to the left of each legend label.
- legend label#
The text which describes the handle represented by the key.
- legend handle#
The original object which is used to generate an appropriate entry in the legend.
Controlling the legend entries#
Calling legend() with no arguments automatically fetches the legend
handles and their associated labels. This functionality is equivalent to:
handles, labels = ax.get_legend_handles_labels()
ax.legend(handles, labels)
The get_legend_handles_labels() function returns
a list of handles/artists which exist on the Axes which can be used to
generate entries for the resulting legend - it is worth noting however that
not all artists can be added to a legend, at which point a "proxy" will have
to be created (see Creating artists specifically for adding to the legend (aka. Proxy artists) for further details).
Those artists with an empty string as label or with a label starting with "_" will be ignored.
For full control of what is being added to the legend, it is common to pass
the appropriate handles directly to legend():
fig, ax = plt.subplots()
line_up, = ax.plot([1, 2, 3], label='Line 2')
line_down, = ax.plot([3, 2, 1], label='Line 1')
ax.legend(handles=[line_up, line_down])
In some cases, it is not possible to set the label of the handle, so it is
possible to pass through the list of labels to legend():
fig, ax = plt.subplots()
line_up, = ax.plot([1, 2, 3], label='Line 2')
line_down, = ax.plot([3, 2, 1], label='Line 1')
ax.legend([line_up, line_down], ['Line Up', 'Line Down'])
Creating artists specifically for adding to the legend (aka. Proxy artists)#
Not all handles can be turned into legend entries automatically, so it is often necessary to create an artist which can. Legend handles don't have to exist on the Figure or Axes in order to be used.
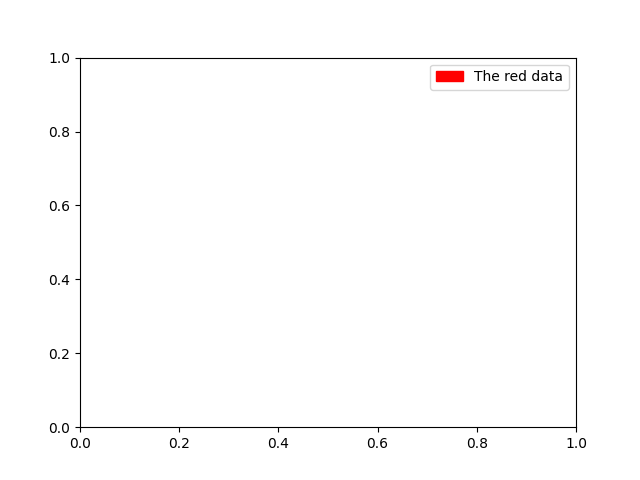
Suppose we wanted to create a legend which has an entry for some data which is represented by a red color:
import matplotlib.patches as mpatches
import matplotlib.pyplot as plt

fig, ax = plt.subplots()
red_patch = mpatches.Patch(color='red', label='The red data')
ax.legend(handles=[red_patch])

plt.show()
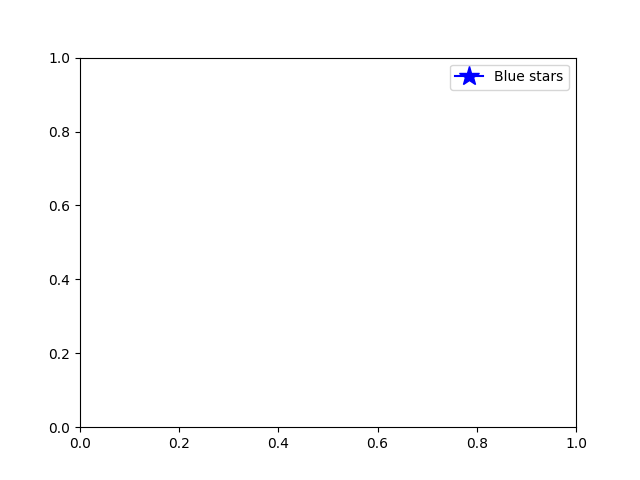
There are many supported legend handles. Instead of creating a patch of color we could have created a line with a marker:
import matplotlib.lines as mlines

fig, ax = plt.subplots()
blue_line = mlines.Line2D([], [], color='blue', marker='*',
                          markersize=15, label='Blue stars')
ax.legend(handles=[blue_line])

plt.show()
Legend location#
The location of the legend can be specified by the keyword argument
loc. Please see the documentation at legend() for more details.
The bbox_to_anchor keyword gives a great degree of control for manual
legend placement. For example, if you want your axes legend located at the
figure's top right-hand corner instead of the axes' corner, simply specify
the corner's location and the coordinate system of that location:
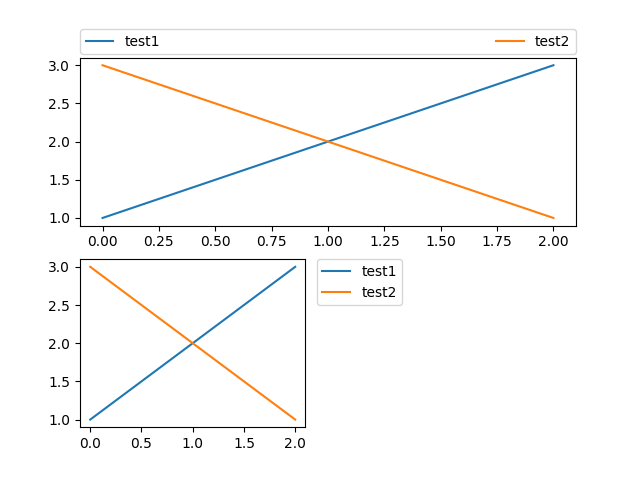
More examples of custom legend placement:
fig, ax_dict = plt.subplot_mosaic([['top', 'top'], ['bottom', 'BLANK']],
                                  empty_sentinel="BLANK")
ax_dict['top'].plot([1, 2, 3], label="test1")
ax_dict['top'].plot([3, 2, 1], label="test2")
# Place a legend above this subplot, expanding itself to
# fully use the given bounding box.
ax_dict['top'].legend(bbox_to_anchor=(0., 1.02, 1., .102), loc='lower left',
                      ncol=2, mode="expand", borderaxespad=0.)

ax_dict['bottom'].plot([1, 2, 3], label="test1")
ax_dict['bottom'].plot([3, 2, 1], label="test2")
# Place a legend to the right of this smaller subplot.
ax_dict['bottom'].legend(bbox_to_anchor=(1.05, 1),
                         loc='upper left', borderaxespad=0.)

plt.show()
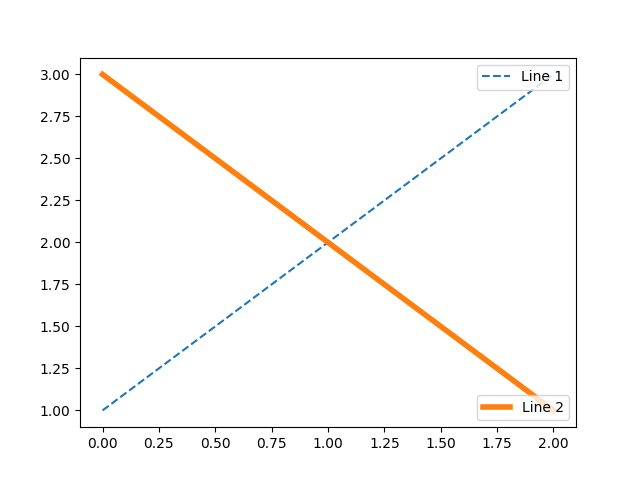
Multiple legends on the same Axes#
Sometimes it is more clear to split legend entries across multiple
legends. Whilst the instinctive approach to doing this might be to call
the legend() function multiple times, you will find that only one
legend ever exists on the Axes. This has been done so that it is possible
to call legend() repeatedly to update the legend to the latest
handles on the Axes. To keep old legend instances, we must add them
manually to the Axes:
fig, ax = plt.subplots()
line1, = ax.plot([1, 2, 3], label="Line 1", linestyle='--')
line2, = ax.plot([3, 2, 1], label="Line 2", linewidth=4)

# Create a legend for the first line.
first_legend = ax.legend(handles=[line1], loc='upper right')

# Add the legend manually to the Axes.
ax.add_artist(first_legend)

# Create another legend for the second line.
ax.legend(handles=[line2], loc='lower right')

plt.show()
Legend Handlers#
In order to create legend entries, handles are given as an argument to an
appropriate HandlerBase subclass.
The choice of handler subclass is determined by the following rules:
Update
get_legend_handler_map()with the value in thehandler_mapkeyword.Check if the
handleis in the newly createdhandler_map.Check if the type of
handleis in the newly createdhandler_map.Check if any of the types in the
handle's mro is in the newly createdhandler_map.
For completeness, this logic is mostly implemented in
get_legend_handler().
All of this flexibility means that we have the necessary hooks to implement custom handlers for our own type of legend key.
The simplest example of using custom handlers is to instantiate one of the
existing legend_handler.HandlerBase subclasses. For the
sake of simplicity, let's choose legend_handler.HandlerLine2D
which accepts a numpoints argument (numpoints is also a keyword
on the legend() function for convenience). We can then pass the mapping
of instance to Handler as a keyword to legend.
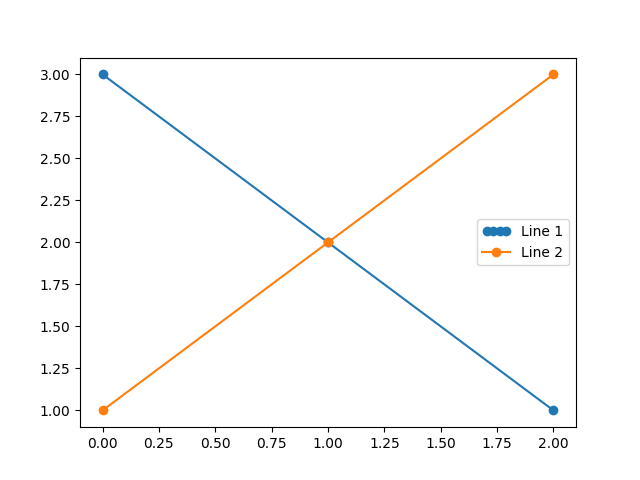
from matplotlib.legend_handler import HandlerLine2D

fig, ax = plt.subplots()
line1, = ax.plot([3, 2, 1], marker='o', label='Line 1')
line2, = ax.plot([1, 2, 3], marker='o', label='Line 2')

ax.legend(handler_map={line1: HandlerLine2D(numpoints=4)})
Out:
<matplotlib.legend.Legend object at 0x7fb668e5f7c0>
As you can see, "Line 1" now has 4 marker points, where "Line 2" has 2 (the
default). Try the above code, only change the map's key from line1 to
type(line1). Notice how now both Line2D instances get 4 markers.
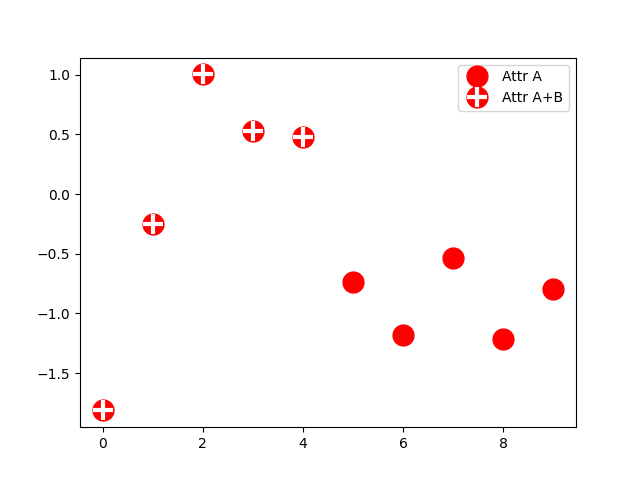
Along with handlers for complex plot types such as errorbars, stem plots
and histograms, the default handler_map has a special tuple handler
(legend_handler.HandlerTuple) which simply plots the handles on top of one
another for each item in the given tuple. The following example demonstrates
combining two legend keys on top of one another:
from numpy.random import randn

z = randn(10)

fig, ax = plt.subplots()
red_dot, = ax.plot(z, "ro", markersize=15)
# Put a white cross over some of the data.
white_cross, = ax.plot(z[:5], "w+", markeredgewidth=3, markersize=15)

ax.legend([red_dot, (red_dot, white_cross)], ["Attr A", "Attr A+B"])
Out:
<matplotlib.legend.Legend object at 0x7fb669788730>
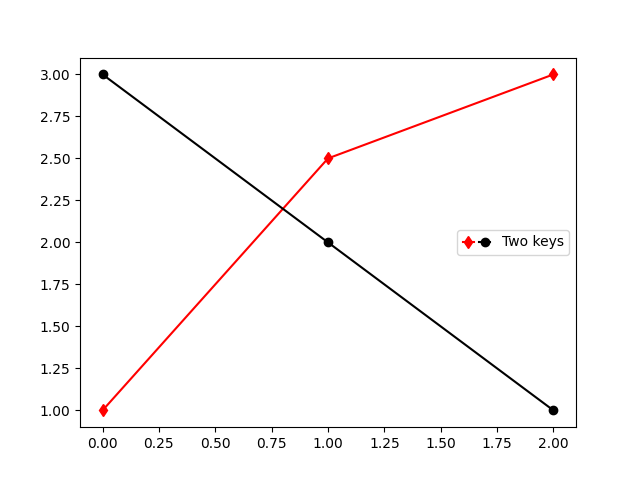
The legend_handler.HandlerTuple class can also be used to
assign several legend keys to the same entry:
from matplotlib.legend_handler import HandlerLine2D, HandlerTuple

fig, ax = plt.subplots()
p1, = ax.plot([1, 2.5, 3], 'r-d')
p2, = ax.plot([3, 2, 1], 'k-o')

l = ax.legend([(p1, p2)], ['Two keys'], numpoints=1,
              handler_map={tuple: HandlerTuple(ndivide=None)})
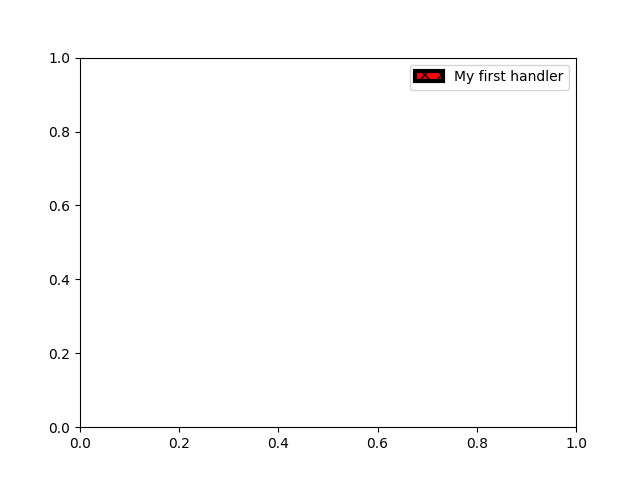
Implementing a custom legend handler#
A custom handler can be implemented to turn any handle into a legend key
(handles don't necessarily need to be matplotlib artists). The handler must
implement a legend_artist method which returns a single artist for the
legend to use. The required signature for legend_artist is documented at
legend_artist.
import matplotlib.patches as mpatches


class AnyObject:
    pass


class AnyObjectHandler:
    def legend_artist(self, legend, orig_handle, fontsize, handlebox):
        x0, y0 = handlebox.xdescent, handlebox.ydescent
        width, height = handlebox.width, handlebox.height
        patch = mpatches.Rectangle([x0, y0], width, height, facecolor='red',
                                   edgecolor='black', hatch='xx', lw=3,
                                   transform=handlebox.get_transform())
        handlebox.add_artist(patch)
        return patch

fig, ax = plt.subplots()

ax.legend([AnyObject()], ['My first handler'],
          handler_map={AnyObject: AnyObjectHandler()})
Out:
<matplotlib.legend.Legend object at 0x7fb66980dff0>
Alternatively, had we wanted to globally accept AnyObject instances
without needing to manually set the handler_map keyword all the time, we
could have registered the new handler with:
from matplotlib.legend import Legend
Legend.update_default_handler_map({AnyObject: AnyObjectHandler()})
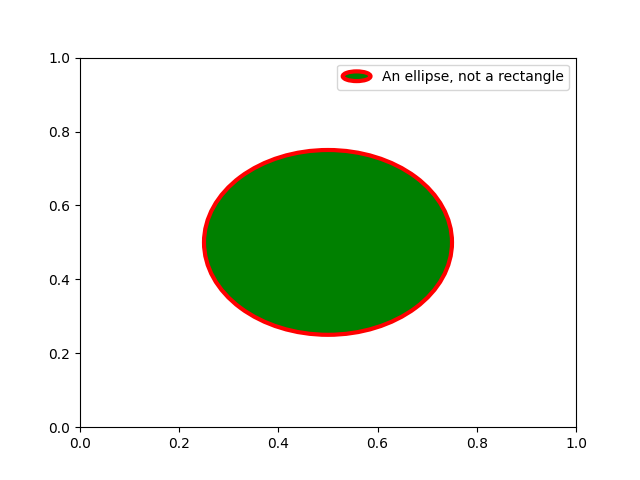
Whilst the power here is clear, remember that there are already many handlers implemented and what you want to achieve may already be easily possible with existing classes. For example, to produce elliptical legend keys, rather than rectangular ones:
from matplotlib.legend_handler import HandlerPatch


class HandlerEllipse(HandlerPatch):
    def create_artists(self, legend, orig_handle,
                       xdescent, ydescent, width, height, fontsize, trans):
        center = 0.5 * width - 0.5 * xdescent, 0.5 * height - 0.5 * ydescent
        p = mpatches.Ellipse(xy=center, width=width + xdescent,
                             height=height + ydescent)
        self.update_prop(p, orig_handle, legend)
        p.set_transform(trans)
        return [p]


c = mpatches.Circle((0.5, 0.5), 0.25, facecolor="green",
                    edgecolor="red", linewidth=3)

fig, ax = plt.subplots()

ax.add_patch(c)
ax.legend([c], ["An ellipse, not a rectangle"],
          handler_map={mpatches.Circle: HandlerEllipse()})
Out:
<matplotlib.legend.Legend object at 0x7fb6694a4a30>
Total running time of the script: ( 0 minutes 3.076 seconds)
Keywords: matplotlib code example, codex, python plot, pyplot Gallery generated by Sphinx-Gallery