matplotlib.pyplot.tight_layout
- matplotlib.pyplot.tight_layout(*, pad=1.08, h_pad=None, w_pad=None, rect=None)[source]
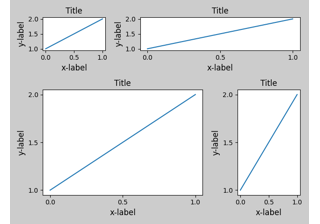
Adjust the padding between and around subplots.
To exclude an artist on the Axes from the bounding box calculation that determines the subplot parameters (i.e. legend, or annotation), set
a.set_in_layout(False)for that artist.- Parameters
- padfloat, default: 1.08
Padding between the figure edge and the edges of subplots, as a fraction of the font size.
- h_pad, w_padfloat, default: pad
Padding (height/width) between edges of adjacent subplots, as a fraction of the font size.
- recttuple (left, bottom, right, top), default: (0, 0, 1, 1)
A rectangle in normalized figure coordinates into which the whole subplots area (including labels) will fit.