Note
Click here to download the full example code
Pyplot Simple
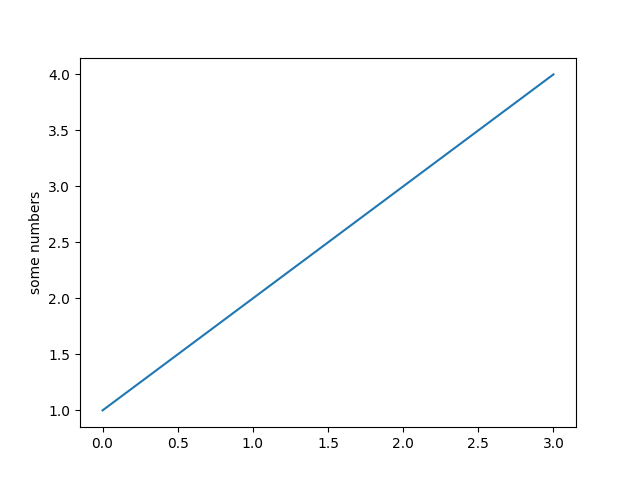
A very simple pyplot where a list of numbers are ploted against their index. Creates a straight line due to the rate of change being 1 for both the X and Y axis.
import matplotlib.pyplot as plt
plt.plot([1, 2, 3, 4])
plt.ylabel('some numbers')
plt.show()
References
The use of the following functions, methods, classes and modules is shown in this example:
Keywords: matplotlib code example, codex, python plot, pyplot Gallery generated by Sphinx-Gallery