matplotlib.pyplot.bar_label
-
matplotlib.pyplot.bar_label(container, labels=None, *, fmt='%g', label_type='edge', padding=0, **kwargs)[source]¶ Label a bar plot.
Adds labels to bars in the given
BarContainer. You may need to adjust the axis limits to fit the labels.Parameters: - container
BarContainer Container with all the bars and optionally errorbars, likely returned from
barorbarh.- labelsarray-like, optional
A list of label texts, that should be displayed. If not given, the label texts will be the data values formatted with fmt.
- fmtstr, default: '%g'
A format string for the label.
- label_type{'edge', 'center'}, default: 'edge'
The label type. Possible values:
- 'edge': label placed at the end-point of the bar segment, and the value displayed will be the position of that end-point.
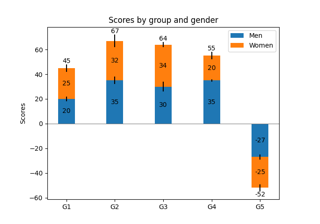
- 'center': label placed in the center of the bar segment, and the value displayed will be the length of that segment. (useful for stacked bars, i.e., Bar Label Demo)
- paddingfloat, default: 0
Distance of label from the end of the bar, in points.
- **kwargs
Any remaining keyword arguments are passed through to
Axes.annotate.
Returns: - container