Note
Click here to download the full example code
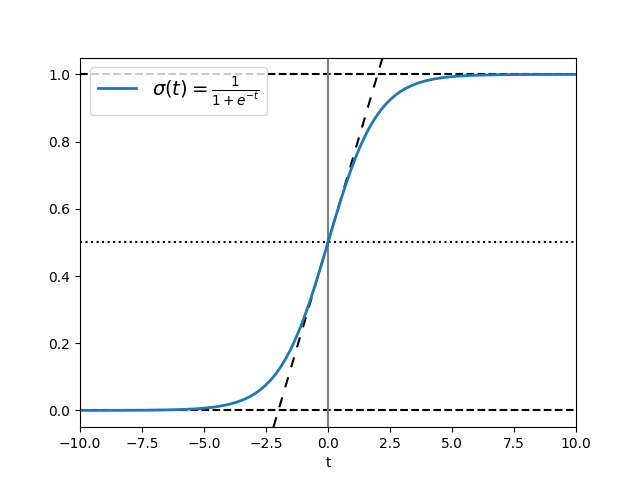
Infinite lines
axvline and axhline draw infinite vertical /
horizontal lines, at given x / y positions. They are usually used to mark
special data values, e.g. in this example the center and limit values of the
sigmoid function.
axline draws infinite straight lines in arbitrary directions.
import numpy as np
import matplotlib.pyplot as plt

t = np.linspace(-10, 10, 100)
sig = 1 / (1 + np.exp(-t))

plt.axhline(y=0, color="black", linestyle="--")
plt.axhline(y=0.5, color="black", linestyle=":")
plt.axhline(y=1.0, color="black", linestyle="--")
plt.axvline(color="grey")
plt.axline((0, 0.5), slope=0.25, color="black", linestyle=(0, (5, 5)))
plt.plot(t, sig, linewidth=2, label=r"$\sigma(t) = \frac{1}{1 + e^{-t}}$")
plt.xlim(-10, 10)
plt.xlabel("t")
plt.legend(fontsize=14)
plt.show()
References
The use of the following functions, methods, classes and modules is shown in this example:
Out:
<function Axes.axline at 0x7fba54b450d0>
Keywords: matplotlib code example, codex, python plot, pyplot Gallery generated by Sphinx-Gallery