Note
Click here to download the full example code
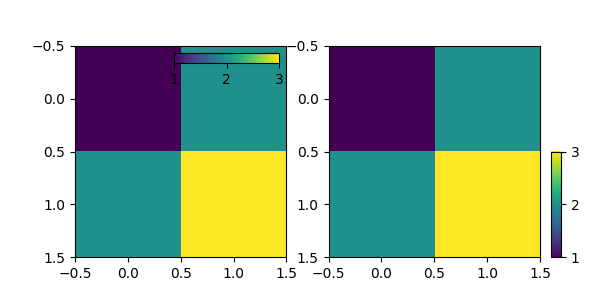
Controlling the position and size of colorbars with Inset Axes
This example shows how to control the position, height, and width of
colorbars using inset_axes.
Controlling the placement of the inset axes is done similarly as that of the legend: either by providing a location option ("upper right", "best", ...), or by providing a locator with respect to the parent bbox.
import matplotlib.pyplot as plt

from mpl_toolkits.axes_grid1.inset_locator import inset_axes

fig, (ax1, ax2) = plt.subplots(1, 2, figsize=[6, 3])

axins1 = inset_axes(ax1,
                    width="50%",  # width = 50% of parent_bbox width
                    height="5%",  # height : 5%
                    loc='upper right')

im1 = ax1.imshow([[1, 2], [2, 3]])
fig.colorbar(im1, cax=axins1, orientation="horizontal", ticks=[1, 2, 3])
axins1.xaxis.set_ticks_position("bottom")

axins = inset_axes(ax2,
                   width="5%",  # width = 5% of parent_bbox width
                   height="50%",  # height : 50%
                   loc='lower left',
                   bbox_to_anchor=(1.05, 0., 1, 1),
                   bbox_transform=ax2.transAxes,
                   borderpad=0,
                   )

# Controlling the placement of the inset axes is basically same as that
# of the legend.  you may want to play with the borderpad value and
# the bbox_to_anchor coordinate.

im = ax2.imshow([[1, 2], [2, 3]])
fig.colorbar(im, cax=axins, ticks=[1, 2, 3])

plt.show()
Keywords: matplotlib code example, codex, python plot, pyplot Gallery generated by Sphinx-Gallery