matplotlib.pyplot.xticks
-
matplotlib.pyplot.xticks(ticks=None, labels=None, **kwargs)[source]¶ Get or set the current tick locations and labels of the x-axis.
Pass no arguments to return the current values without modifying them.
Parameters: - ticksarray-like, optional
The list of xtick locations. Passing an empty list removes all xticks.
- labelsarray-like, optional
The labels to place at the given ticks locations. This argument can only be passed if ticks is passed as well.
- **kwargs
Textproperties can be used to control the appearance of the labels.
Returns: - locs
The list of xtick locations.
- labels
The list of xlabel
Textobjects.
Notes
Calling this function with no arguments (e.g.
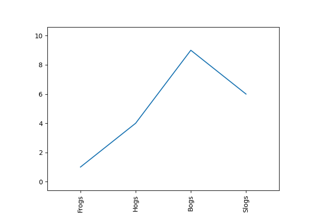
xticks()) is the pyplot equivalent of callingget_xticksandget_xticklabelson the current axes. Calling this function with arguments is the pyplot equivalent of callingset_xticksandset_xticklabelson the current axes.Examples
>>> locs, labels = xticks()  # Get the current locations and labels.
>>> xticks(np.arange(0, 1, step=0.2))  # Set label locations.
>>> xticks(np.arange(3), ['Tom', 'Dick', 'Sue'])  # Set text labels.
>>> xticks([0, 1, 2], ['January', 'February', 'March'],
...        rotation=20)  # Set text labels and properties.
>>> xticks([])  # Disable xticks.