Note
Click here to download the full example code
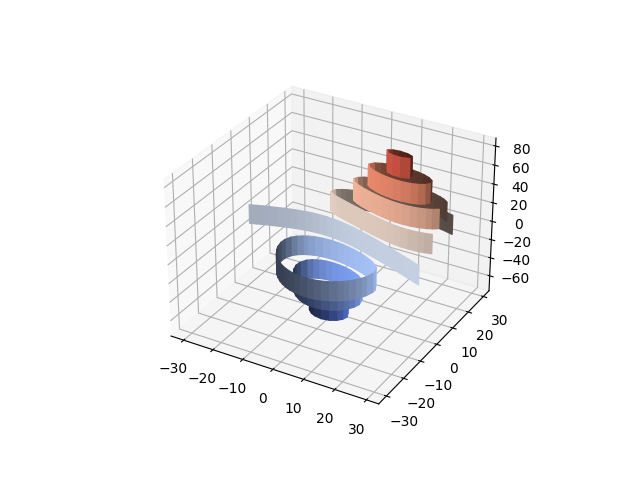
Demonstrates plotting contour (level) curves in 3D using the extend3d option
This modification of the contour3d_demo example uses extend3d=True to extend the curves vertically into 'ribbons'.
from mpl_toolkits.mplot3d import axes3d
import matplotlib.pyplot as plt
from matplotlib import cm

fig = plt.figure()
ax = fig.gca(projection='3d')
X, Y, Z = axes3d.get_test_data(0.05)

cset = ax.contour(X, Y, Z, extend3d=True, cmap=cm.coolwarm)

ax.clabel(cset, fontsize=9, inline=True)

plt.show()
Keywords: matplotlib code example, codex, python plot, pyplot Gallery generated by Sphinx-Gallery