Note
Click here to download the full example code
Demo Curvelinear Grid2
Custom grid and ticklines.
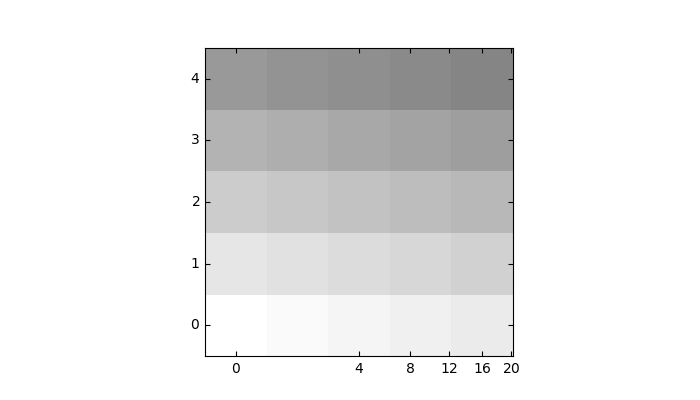
This example demonstrates how to use GridHelperCurveLinear to define custom grids and ticklines by applying a transformation on the grid. As showcase on the plot, a 5x5 matrix is displayed on the axes.
import numpy as np
import matplotlib.pyplot as plt

from mpl_toolkits.axisartist.grid_helper_curvelinear import (
    GridHelperCurveLinear)
from mpl_toolkits.axisartist.grid_finder import (
    ExtremeFinderSimple, MaxNLocator)
from mpl_toolkits.axisartist.axislines import Subplot


def curvelinear_test1(fig):
    """Grid for custom transform."""

    def tr(x, y):
        sgn = np.sign(x)
        x, y = np.abs(np.asarray(x)), np.asarray(y)
        return sgn*x**.5, y

    def inv_tr(x, y):
        sgn = np.sign(x)
        x, y = np.asarray(x), np.asarray(y)
        return sgn*x**2, y

    grid_helper = GridHelperCurveLinear(
        (tr, inv_tr),
        extreme_finder=ExtremeFinderSimple(20, 20),
        # better tick density
        grid_locator1=MaxNLocator(nbins=6), grid_locator2=MaxNLocator(nbins=6))

    ax1 = Subplot(fig, 111, grid_helper=grid_helper)
    # ax1 will have a ticks and gridlines defined by the given
    # transform (+ transData of the Axes). Note that the transform of the Axes
    # itself (i.e., transData) is not affected by the given transform.

    fig.add_subplot(ax1)

    ax1.imshow(np.arange(25).reshape(5, 5),
               vmax=50, cmap=plt.cm.gray_r, origin="lower")


if __name__ == "__main__":
    fig = plt.figure(figsize=(7, 4))
    curvelinear_test1(fig)
    plt.show()
Keywords: matplotlib code example, codex, python plot, pyplot Gallery generated by Sphinx-Gallery